EDIT MODE · click text to change it · press E to exit
Liquid Claims on Illiquid Assets:
The Economics of Retail Access to Private Markets
Michael Ewens and Jacob FaberColumbia Business School
Columbia Business School
Ewens and Faber · NHH 2026
Columbia Business School
Ewens and Faber · NHH 2026
Columbia Business School
Ewens and Faber · NHH 2026
Why
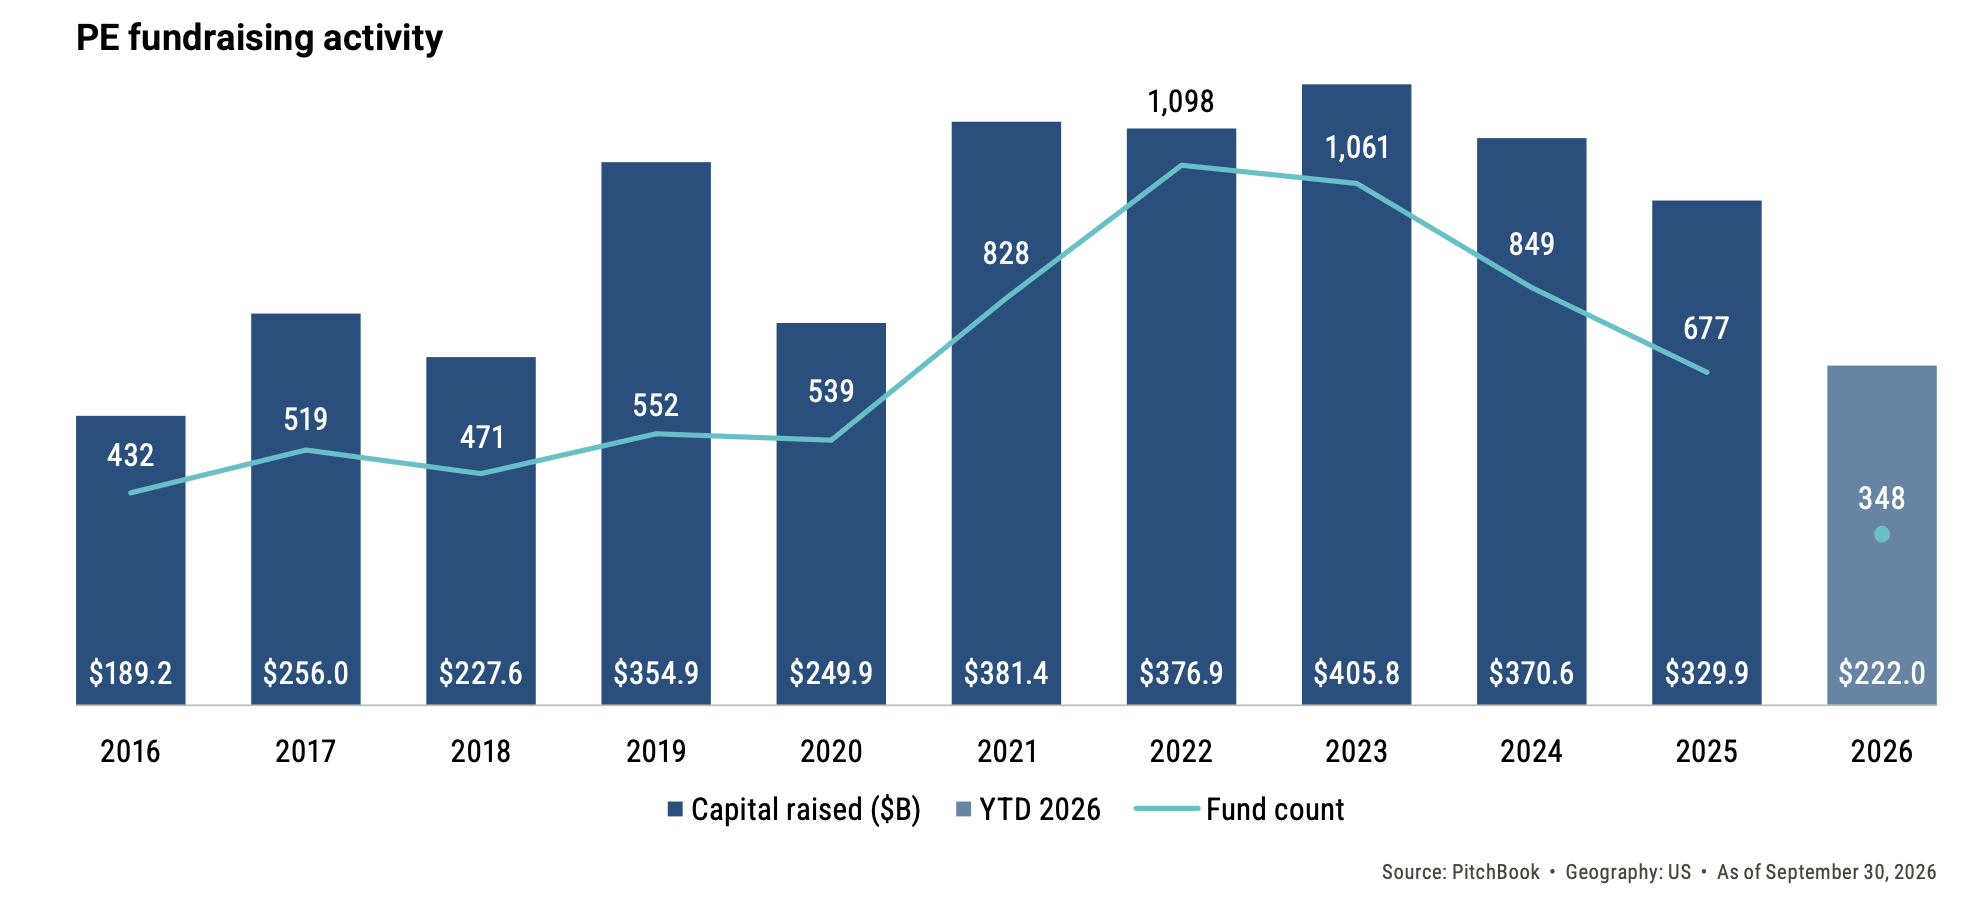
Decline in fundraising
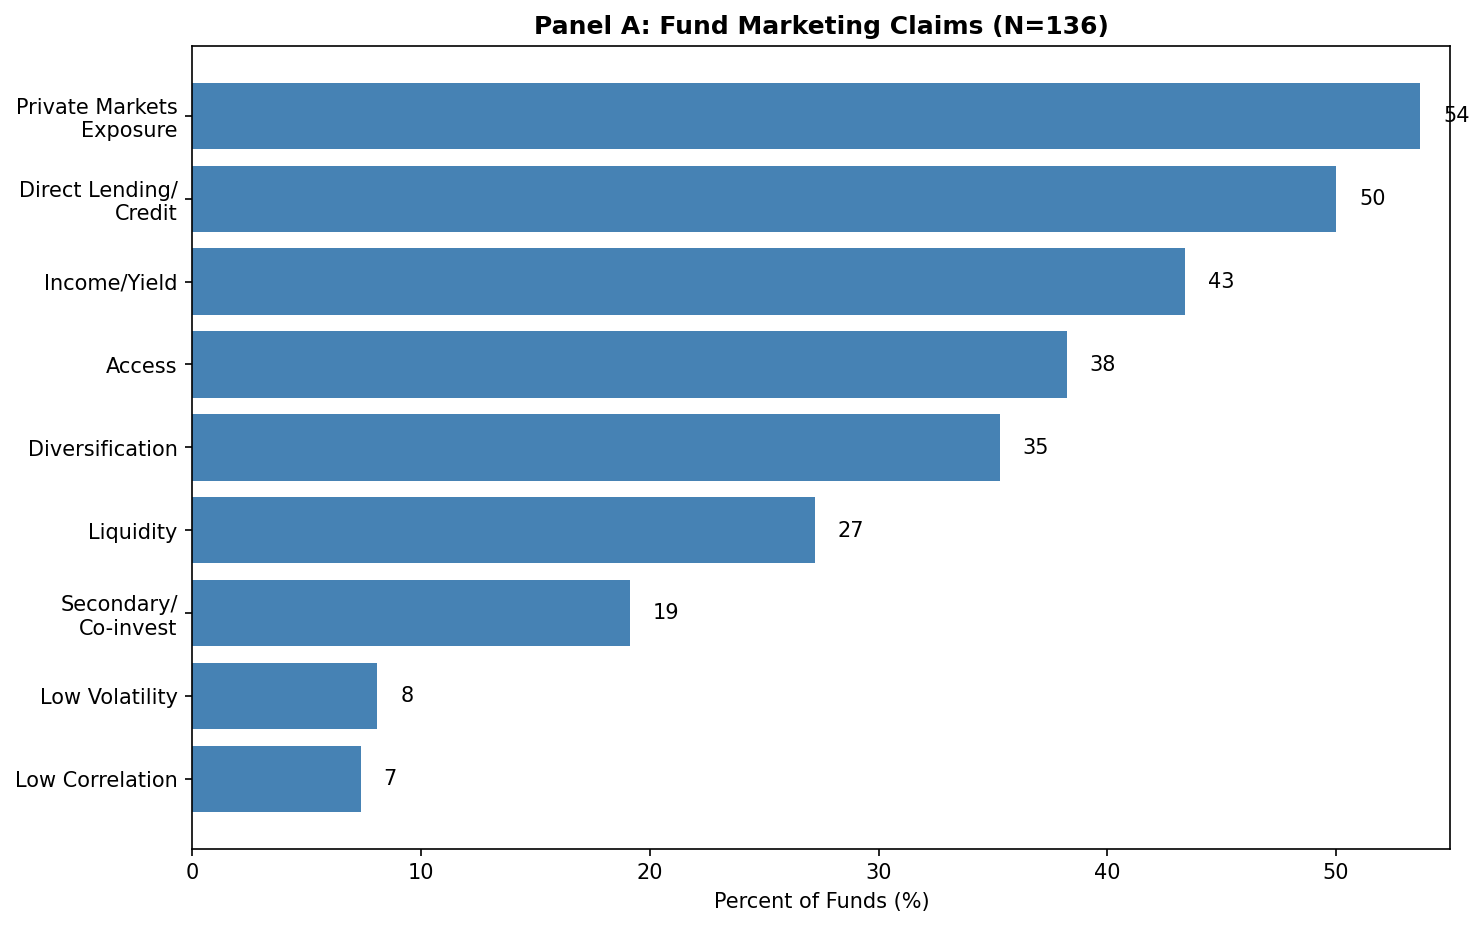
Pitches by the industry
Illiquidity premium, diversificaton, and alpha
Columbia Business School
Ewens and Faber · NHH 2026
The implicit promise of private market access
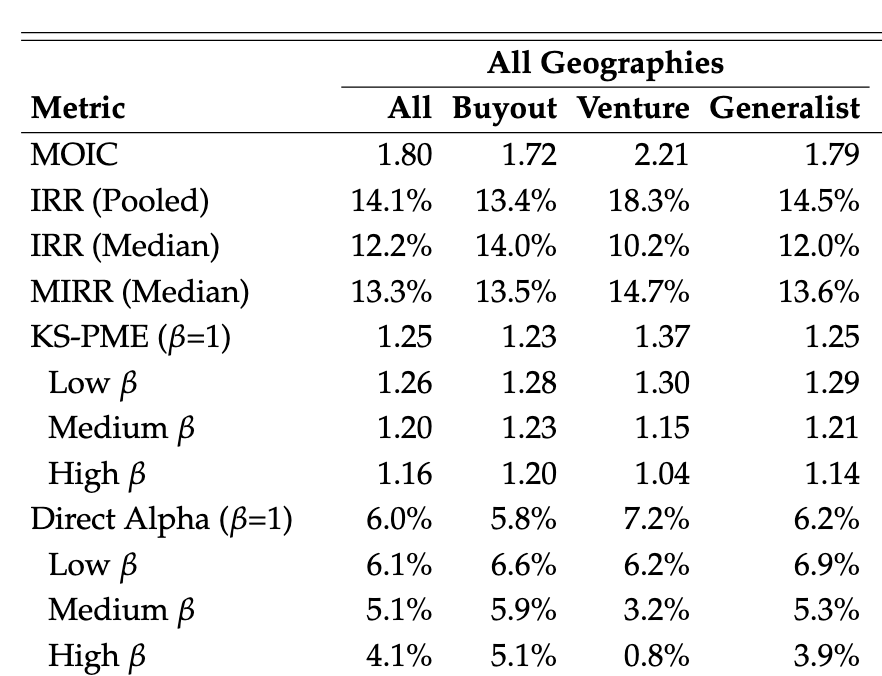
Outline: Academic studies (Brown and Kaplan)
Columbia Business School
Ewens and Faber · NHH 2026
The new vehicles (wrappers)
Interval and Tender Offer Funds
Non-diversified, registered closed-end funds → hold a lot of private, illiquid assets
Not traded
Can – with conditions – sell shares to retail investors
Challenge: allow entry and (regular) exit, but hold illiquid assets
Columbia Business School
Ewens and Faber · NHH 2026
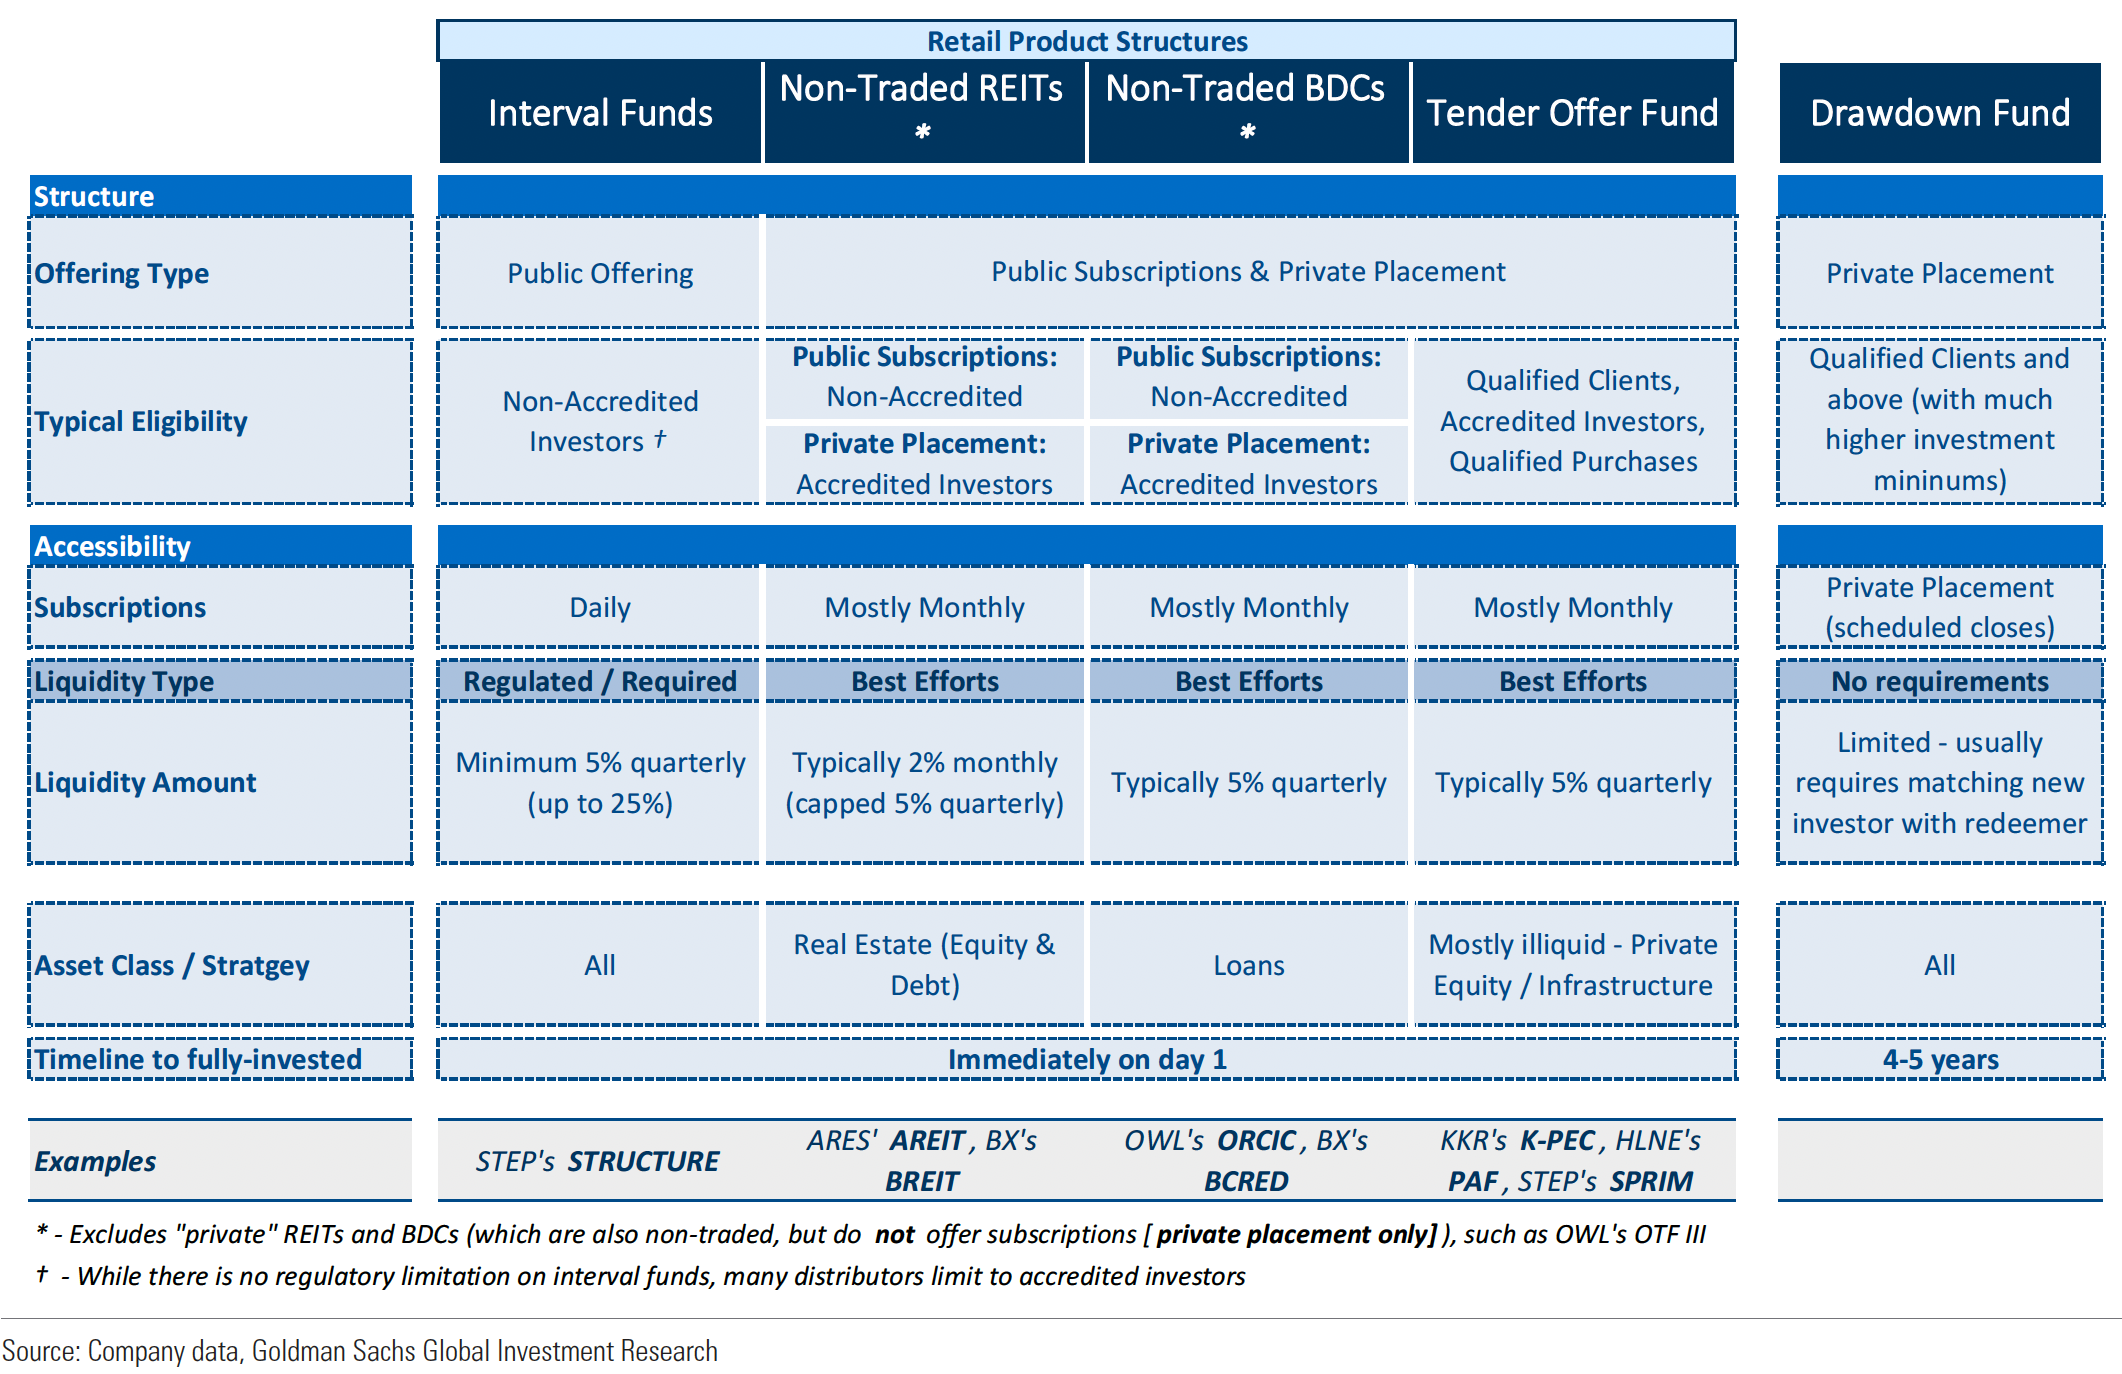
Drawdown funds vs. the new wrappers
Drawdown fund
Interval and tender offer funds
Capital
A new fund every 3–5 years
Evergreen: money in daily to monthly
Ownership
Active: GPs own the companies
Mainly passive: fund-of-funds, co-investment
Holds
4–10 years
Similar: 4–10 years
Exit
GP choice; few secondaries
Investors, at least quarterly, with gating
Prices
None: GP marks and audits
Daily NAVs; investors trade at them
Skin in the game
Expected
Not required; most have some (~1.5%)
Pay
Profit sharing; fees on book value
Little profit sharing; fees on marked NAV
Investors
Institutions
Anyone, in about half of funds
Replaces the separate drawdown-fund and registered-fund slides (both in Backup).
Columbia Business School
Ewens and Faber · NHH 2026
What are interval and tender-offer funds?
Investors
Subscribe on offered dates, priced from NAV
Cash only via a repurchase offer (no right to redeem)
The fund
Buy once at NAV. The exit is where interval and tender-offer funds differ.
Interval fund Offer is required, at least 5% of shares
Requests vs. offer
≤ offer
All paid at NAV within 7 days
> offer
Pro rata (gated)
Tender offer fund Board decides: offer about 5% of NAV, or skip
No offer: wait for the next one
Requests vs. offer
≤ offer
All paid at NAV (part held back to the audit)
> offer
Pro rata (gated)
Columbia Business School
Ewens and Faber · NHH 2026
Four stressors
1. Two-sided liquidity
Investors buy and sell roughly when they want → pressure on deployment, deal flow and asset sales
2. Evergreen structure
No fundraising or exit cycle → fees on manager-marked NAV, weaker incentives
3. The regulatory wrapper
Daily pricing, disclosure, boards, limits on performance fees
4. Retail is not institutional
Behavior, information, distribution through brokers
Manager skill limited throughout
Previous outline (Three main stressors (and more)): Liquidity provision (This is a classic problem in banking and in MFs, but different); Evergreen (Different returns generation and incentives); Drawdown fund with little gap b/t GP and deal not yet replicated no active ownership (fund-of-fund or fund-of-co-invest or secondary deals; Some exceptions); TBD: Jake’s figure focused on liquidity (By asset class)
Columbia Business School
Ewens and Faber · NHH 2026
Research questions
How do these vehicles perform against the private-market benchmarks they promise, raw and risk-adjusted?
How large is the gap, and how much of it is fees, cash drag, and lost private-market exposure?
Why does the private-market exposure gap remain: the funds, the wrapper, the investors, or the managers?
Previous outline: How do these vehicles perform and how does that perofmance compare to benchmarks (and risk-adjusted); Given the unique features of these structures and differences with the traditional models, where are the gaps or challenges with “replication”?; Does it belong in a portfolio?
Columbia Business School
Ewens and Faber · NHH 2026
The stressors translate into costs
Retail fund return relative to the institutional benchmark: −1.15% per quarter
Fees
47%
Cash drag
17%
Imperfect private-markets exposure
36%
Providing liquidity is costly: cash drag, plus spillover into holdings
Allowing regular entry: inflows follow returns
Where manager skill matters is narrowed
With retail comes responsibility (and costs)
The drawdown-fund features lost came at a real cost
Dropped from the draft punchline: Allowing exit costs cash drag and tilts the portfolio toward liquid assets; Allowing entry stresses deployment and allocation; The evergreen and regulatory structure weakens incentives and forces model prices; experienced managers do better; Retail is part of the story, not all of it: retail money tends to sit with less experienced managers; Some funds can work; TBD: Do these belong in an individual's portfolio? Probably not without experienced managers at scale.
Previous outline: Gap is meaningful and a lot is fees and cash drag. What remains suggests cost of making the illiquid liquid and a different structure. The economics are… Providing liquidity is costly in cash drag (expected), some spillover into asset types. Skill still matters, but these vehicles constraints are real (Is this *surprising*? If not, it tells us where challenges lie for retirement). Allowing entry stresses deployment and allocation. Providing access to the benefits of alternatives is challenging even for the most experienced private markets investors. Suggests the structure, information, liquidity and incentives put them at an unavoidable disadvantage. Retail investors should probably not, especially if they cannot get experienced access at the right scale. Costs [Do these map to the decomposition? It is fees, cash drag and private market exposure]: Costs of the structure (Fees (relative); Incentives [can’t measure!]); Costs of retail (If they act differently, then could add to cash drag, liquidity tilt, redemption pressure, selection); Costs of liquidity (Cash drag; Selection; Deployment). Reveals challenges of transforming access and non-drawdown structure. Some funds can work, but cash drag and fees are unavoidable in these structures. Do these belong in the individual’s portfolio? (As of now, no. But as with other set)
Columbia Business School
Ewens and Faber · NHH 2026
Related literature
Interval funds trail even accessible alternatives (Pegoraro, Shive, and Zambrana 2025); in BDCs, fees are PE-like and retail money concentrates in the worst funds (Robinson and Wallskog 2026).
Gates and caps soften but don't remove run dynamics in semi-liquid credit (Fang, Goldstein, and Zeng 2026).
Even ideal democratization barely raises retail welfare; sponsors and issuers capture the gains (Pastor, Stambaugh, and Taylor 2026).
PE-owned insurers channel retail-adjacent money into affiliated assets, (Huber, Huber, Shan, and Zhu 2026; Drall and Granato 2027, Calif. L. Rev. forthcoming).
This paper explores the costs of providing access to retail investors.
Columbia Business School
Ewens and Faber · NHH 2026
The fund sample
The fund sample
Decomposition
Two-sided liquidity
Incentives and governance
Retail is not institutional
Does manager experience matter?
Conclusion
Columbia Business School
Ewens and Faber · NHH 2026
Building a sample of retail PE funds
Goal:
Collect all new vehicles retail investors can use to access private markets.*
How:
Has an N-PORT filing (portfolio regulatory filing)
Registered closed-end funds
Tender offer or interval fund (possibly with listed CEF ticker) and
> 80% private assets excluding registered and hedge funds
The current sample: ~160 funds
*Current sample excludes previously available BDCs and REITs (for now)
Columbia Business School
Ewens and Faber · NHH 2026
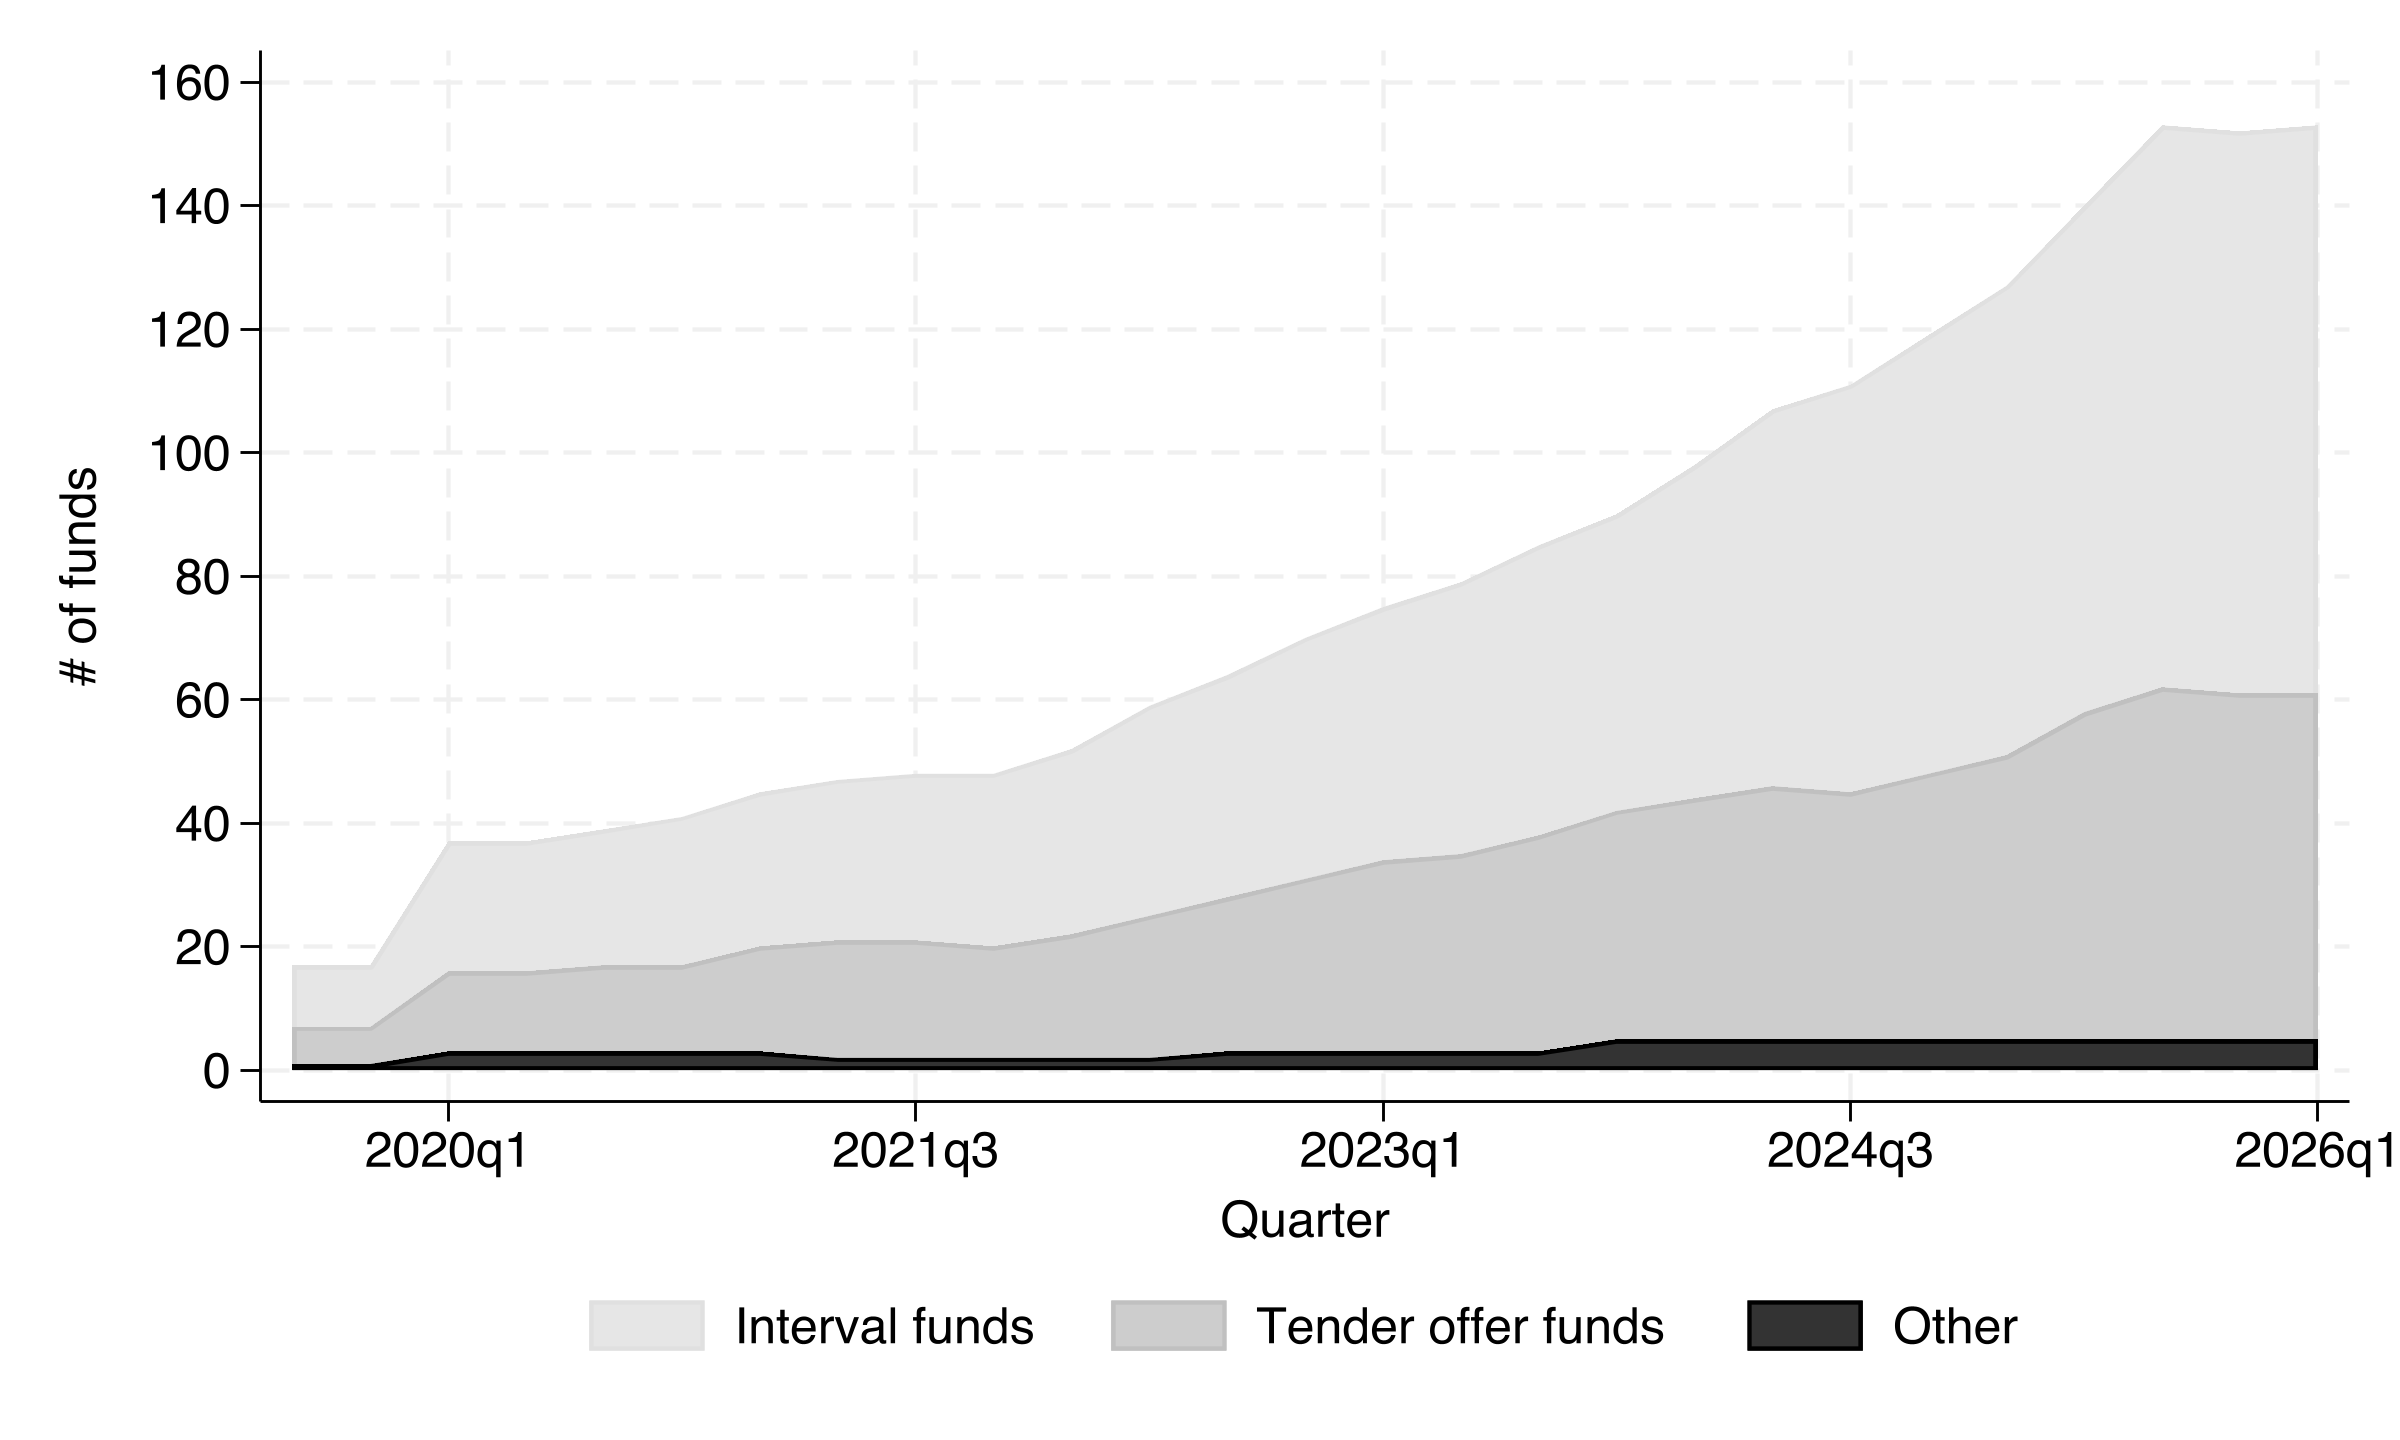
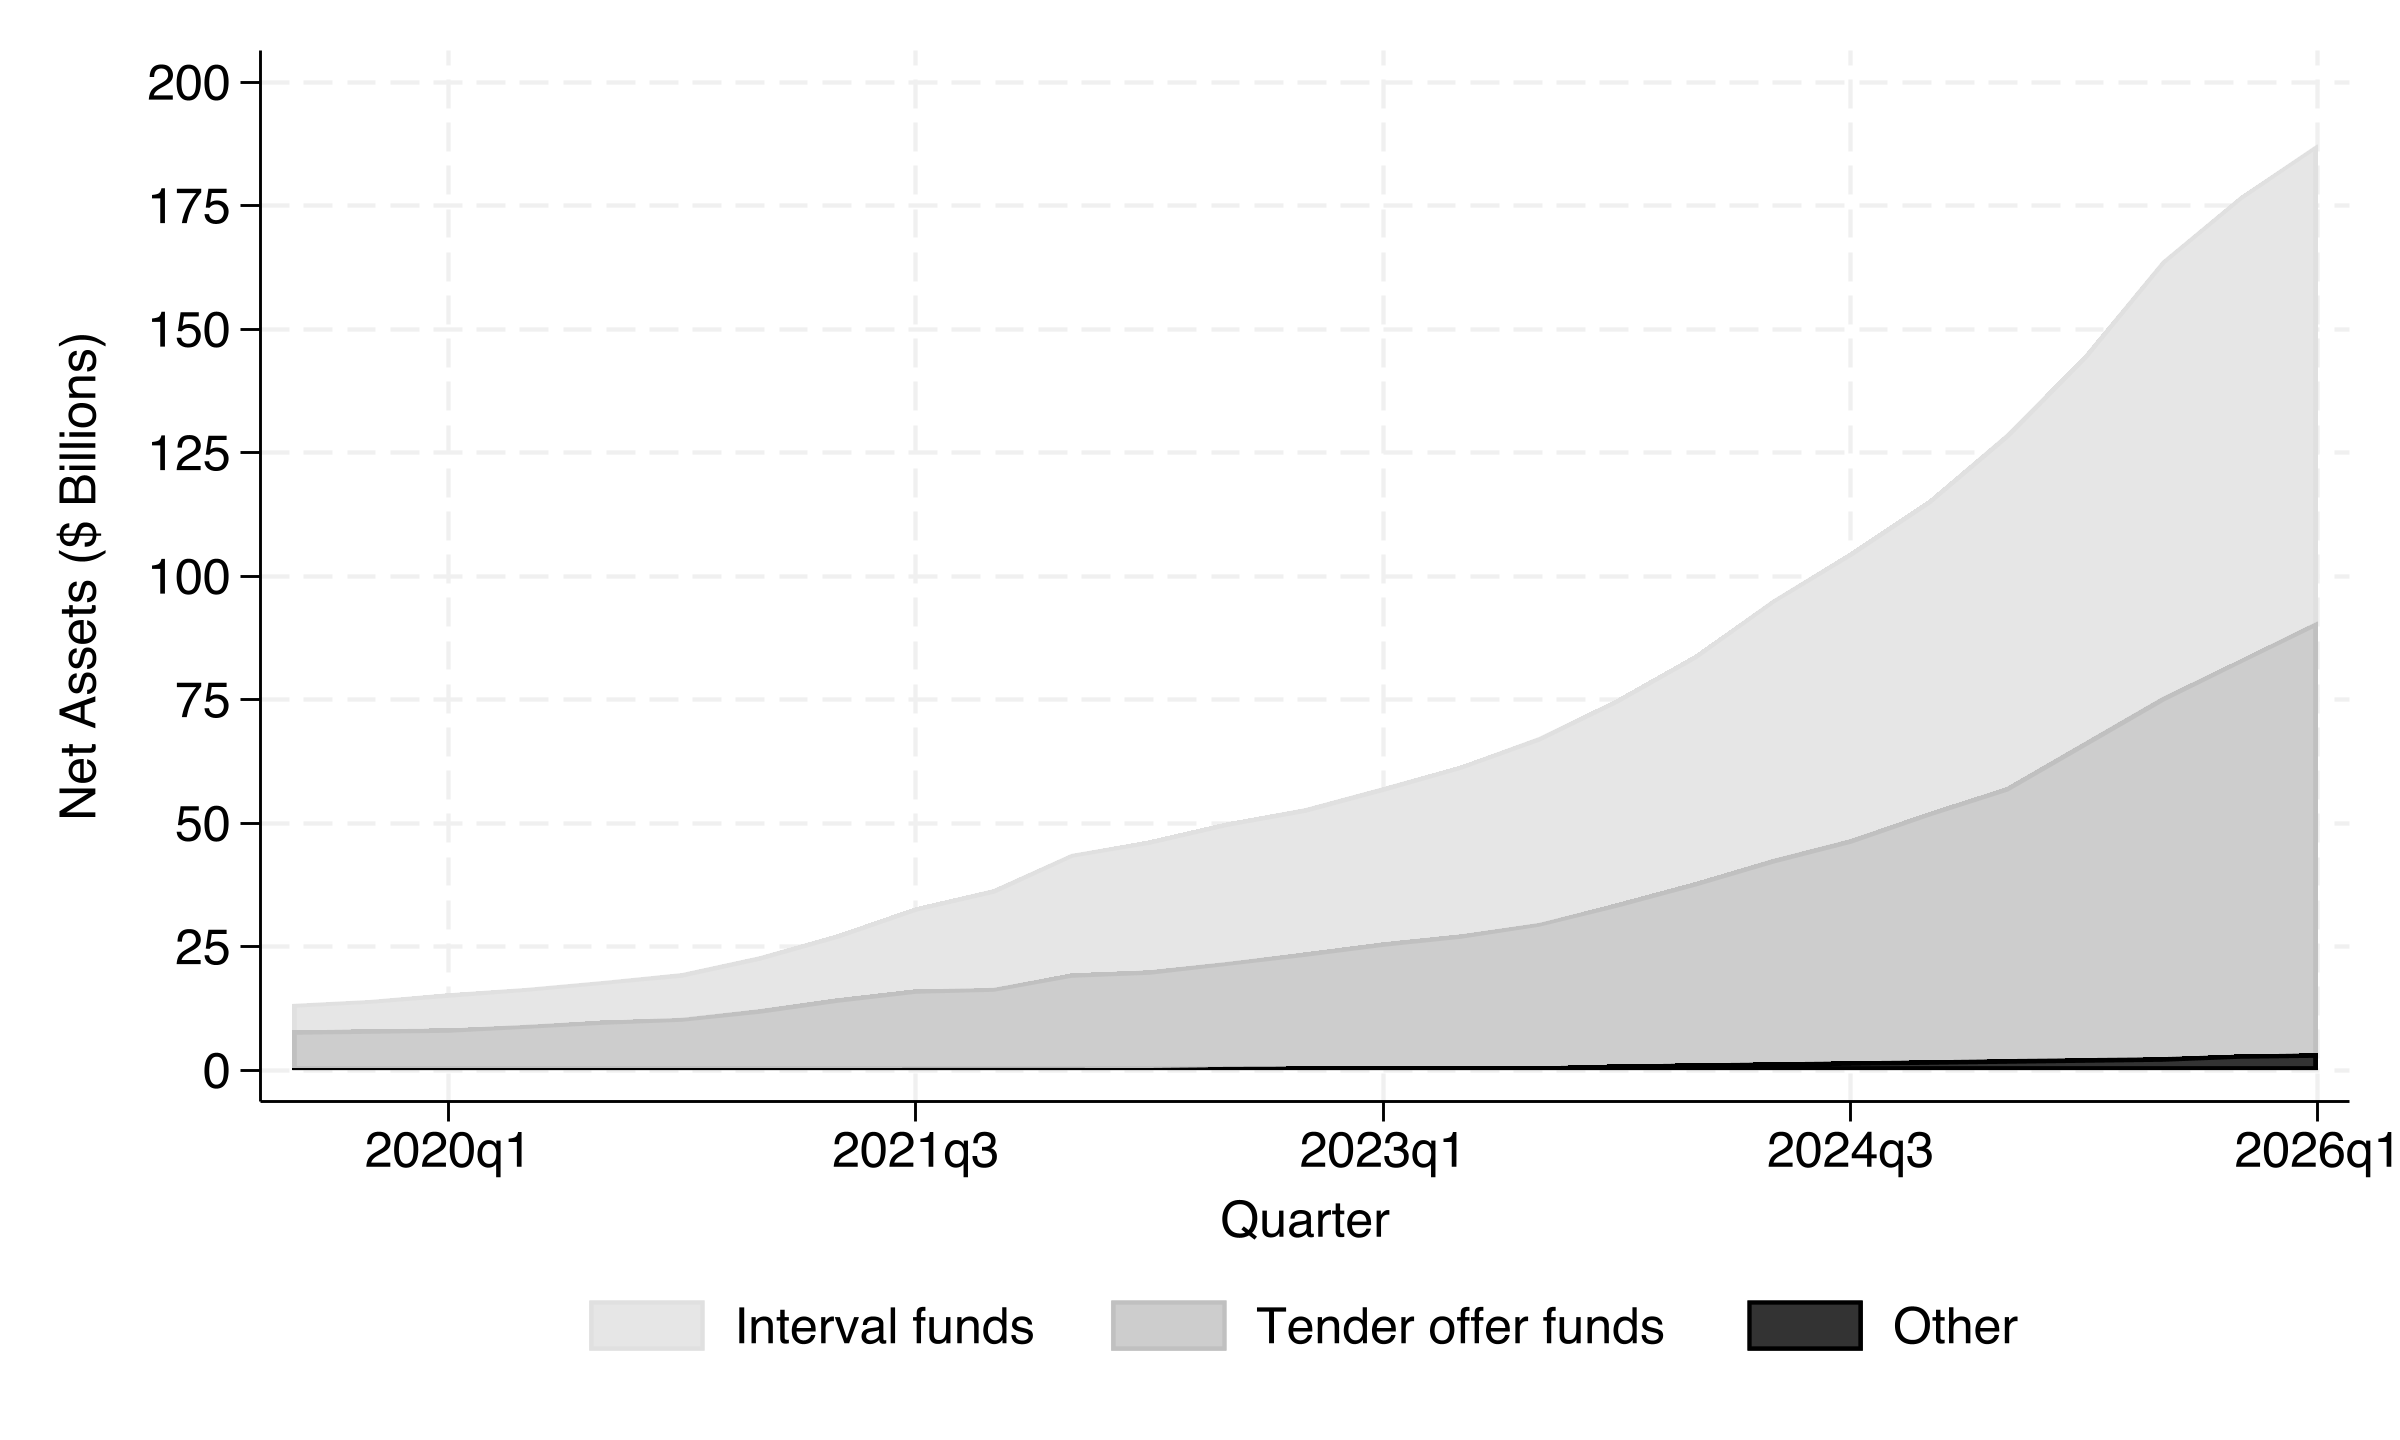
Growth in registered private market funds
Nearly $200b (non-BDCs)
Currently, ~160 funds
Columbia Business School
Ewens and Faber · NHH 2026
Fund-level statistics
Funds are small
Fees not that high
…but lots of waivers
50% allow retail investors
Min.
25%
50%
Mean
75%
95%
N
NAV ($m)
0.1
90.2
350.8
1157.13
878.8
5367.8
163
Mgmt fee (%)
0.0
0.9
1.2
1.18
1.5
1.9
163
Net operating exp. %
0.0
1.5
2.2
2.76
3.4
5.7
163
Expense waiver/cap
0.0
0.0
1.0
0.74
1.0
1.0
163
Any investor
0.0
0.0
0.0
0.49
1.0
1.0
163
Accredited investor
0.0
0.0
0.0
0.35
1.0
1.0
163
Qualified investor
0.0
0.0
0.0
0.13
0.0
1.0
163
Min. investment ($)
0.0
2500.0
10000.0
246034.16
50000.0
1000000.0
161
Interval fund
0.0
0.0
1.0
0.59
1.0
1.0
163
Tender offer
0.0
0.0
0.0
0.37
1.0
1.0
163
Private equity
0.0
0.0
0.0
0.15
0.0
1.0
163
Venture capital
0.0
0.0
0.0
0.10
0.0
1.0
163
Private credit
0.0
0.0
0.0
0.49
1.0
1.0
163
Columbia Business School
Ewens and Faber · NHH 2026
Two example funds
Fund of funds: Princeton Everest Fund
NAV $136m; 36 positions
All in funds: private funds 81%, registered funds 19%
Funds drawn at random (2026-11-03): fund of funds from the 24 PE funds with more than half of NAV in funds; direct equity from the 3 PE/VC funds with under 20% in funds and at least 50% in equity (Private Shares Fund, Sweater Cashmere, ARK Venture). Latest N-PORT, quarter ending 2026-03-31. Princeton Everest: registered funds include a money-market fund (4.3%) and the family Princeton Premium Fund (4.0%). Private Shares Fund: 20 positions (10% of NAV) are single-company vehicles filed as companies, e.g. the Tiger Global vehicle holding Databricks; money market 10.8%. Source: n_port.duckdb positions.
Columbia Business School
Ewens and Faber · NHH 2026
Asset types held
Diversified pools of private assets, held directly and through funds. Does that translate into returns experienced by institutions?
Min.
25%
50%
Mean
75%
95%
Max.
N
# of positions
1.0
49.0
125.0
307.11
303.0
1104.0
19008.0
1479
# private positions
0.0
36.0
94.0
254.16
241.0
897.0
18988.0
1479
% private assets
0.0
0.8
0.9
0.85
1.0
1.0
1.9
1479
% direct
-0.1
0.0
0.6
0.51
0.9
1.0
1.3
1479
% funds
-0.2
0.0
0.3
0.43
0.9
1.0
1.0
1479
% STIV
-0.5
0.0
0.0
0.07
0.1
0.2
1.0
1479
Columbia Business School
Ewens and Faber · NHH 2026
Individual fund positions
Level 3 assets dominate
Small positions; low turnover
Median holding: $0.37M
19% added, 12% sold or matured
3-4 year holds on average
Min.
25%
50%
Mean
75%
95%
N
Holding value (USD m)
-644.07
0.01
0.37
3.36
2.40
14.68
532073
Position size declined
0.00
0.00
0.00
0.37
1.00
1.00
532073
Position size increased
0.00
0.00
0.00
0.25
1.00
1.00
532073
Holding sold/matured
0.00
0.00
0.00
0.12
0.00
1.00
532073
Holding added
0.00
0.00
0.00
0.19
0.00
1.00
532073
Fair value level
Level 1
0.00
0.00
0.00
0.01
0.00
0.00
532073
Level 2
0.00
0.00
0.00
0.22
0.00
1.00
532073
Level 3
0.00
0.00
1.00
0.70
1.00
1.00
532073
Asset type
Debt
0.00
0.00
1.00
0.58
1.00
1.00
532073
Equity
0.00
0.00
0.00
0.08
0.00
1.00
532073
Other
0.00
0.00
0.00
0.20
0.00
1.00
532073
Real estate
0.00
0.00
0.00
0.01
0.00
0.00
532073
Columbia Business School
Ewens and Faber · NHH 2026
Who is allowed
Any investor
Accredited
Qualified clients
Adviser clients / institutional
No wealth or income test; a minimum investment may apply
Income over $200k ($300k joint), or net worth over $1m excluding home
Higher wealth test; the fund may charge performance fees
Adviser clients and institutions only
49% of funds
35% of funds
13% of funds
≈3% of funds
Major unobserved role of brokers and financial advisors
⇒ Complex portfolios of hard-to-value private assets, growing fast: how do they perform?
Outline: Share class and gates
Columbia Business School
Ewens and Faber · NHH 2026
Baseline performance
3-month
6-month
1-year
5-year (ann.)
All funds
1.27
4.37
11.43
8.81
Interval
0.83
3.06
8.58
7.89
Tender offer
1.90
5.47
13.30
10.09
Private credit
0.65
2.51
7.08
8.37
Private equity
1.54
4.35
12.80
9.99
Venture capital
1.90
9.01
21.64
7.38
Real assets
1.67
3.96
10.66
10.17
Funds report quarterly in N-PORT filings
Columbia Business School
Ewens and Faber · NHH 2026
How do they compare to traditional funds?
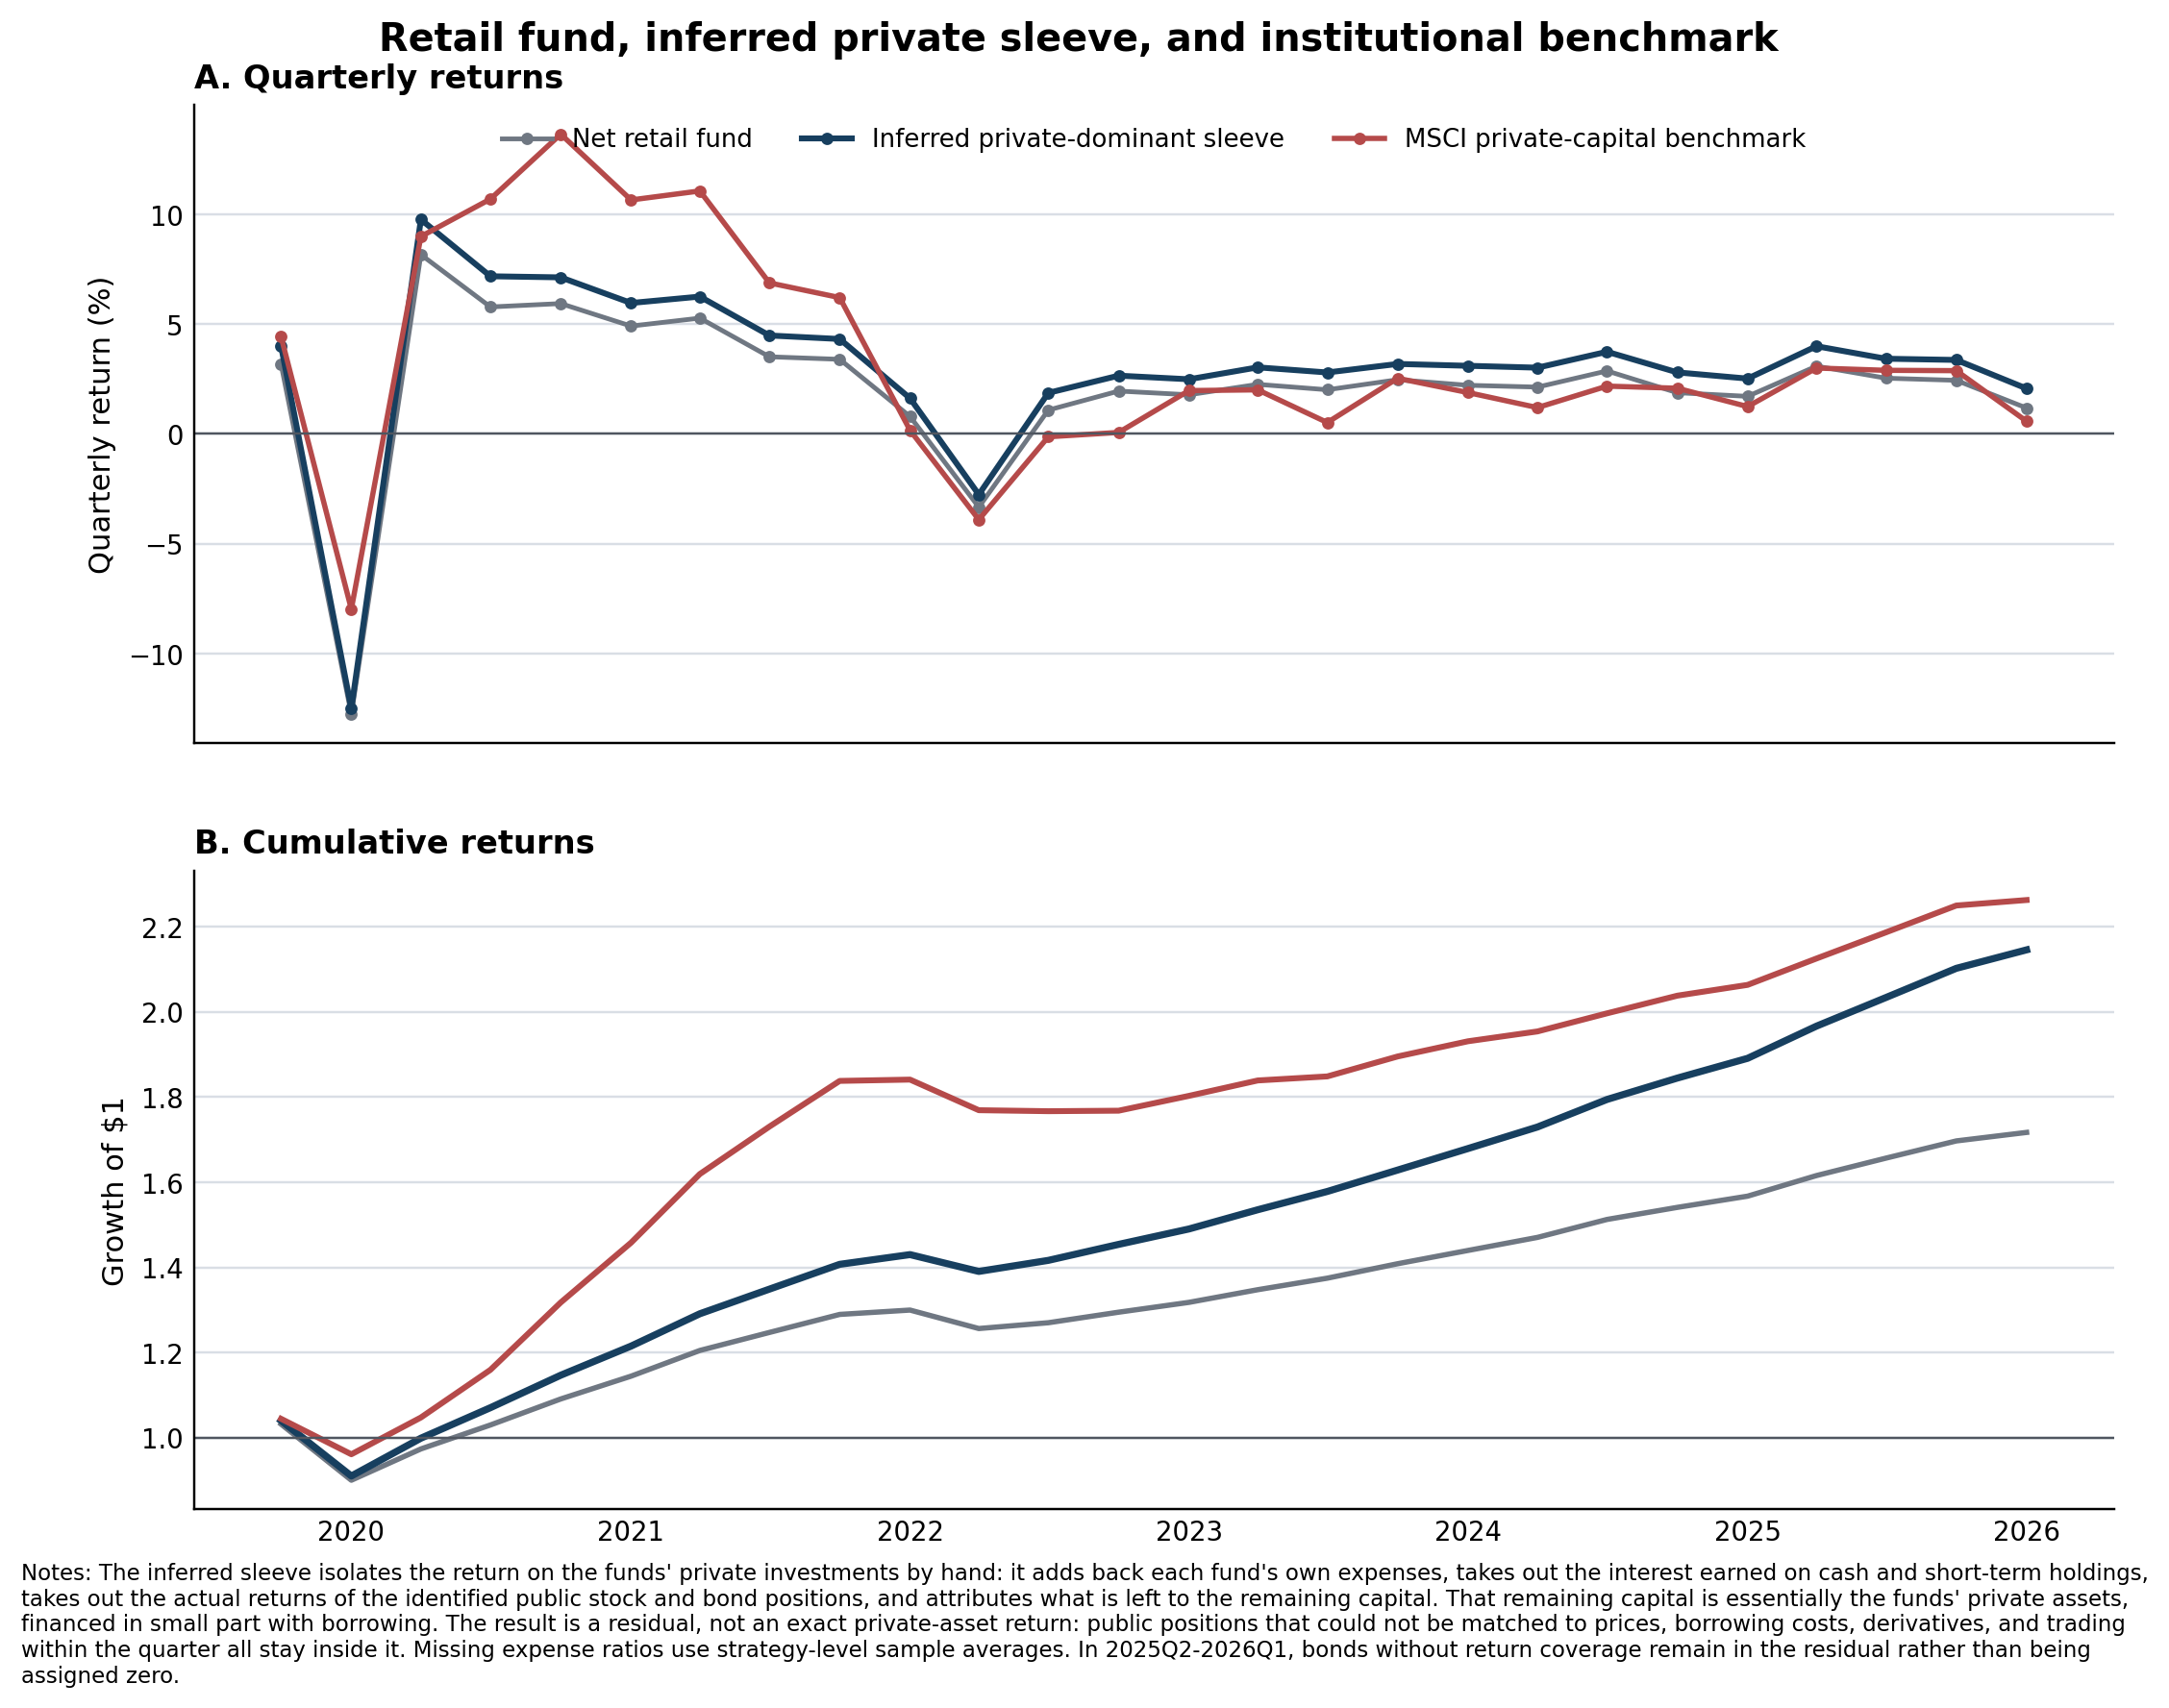
Funds are pitched as “what institutional investors had, you can too!” → compare to the private markets benchmark
Retail return minus MSCI private-capital benchmark, per quarter
-1.15%
All strategies
-0.33%
Private credit
-0.97%
Private equity
-1.74%
Venture capital
All strategies, per year: -4.5%
Columbia Business School
Ewens and Faber · NHH 2026
Decomposition
The fund sample
Decomposition
Two-sided liquidity
Incentives and governance
Retail is not institutional
Does manager experience matter?
Conclusion
Columbia Business School
Ewens and Faber · NHH 2026
Three pieces of the gap
Fees
What the funds charge, what drives it, where it is heading
Liquidity provision
How much the funds hold in liquid assets, and the cash drag
Private-market exposure
How much of the benchmark the funds deliver, and what is left
Columbia Business School
Ewens and Faber · NHH 2026
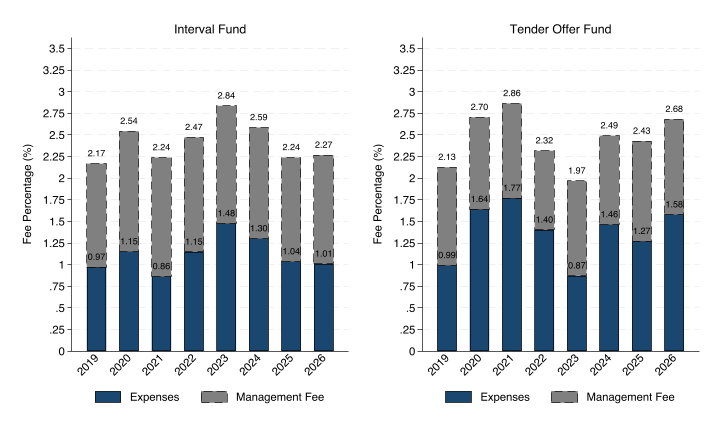
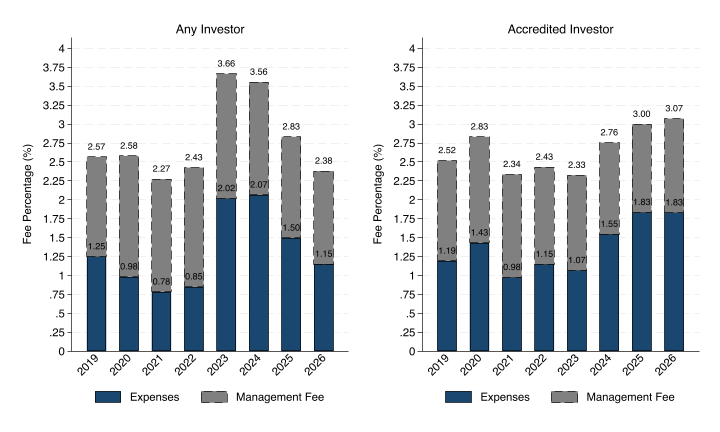
Fees average 2.5% of NAV a year
1.2% is the management fee; interval funds charge 0.22 points more of it than tender offer funds, same total
Funds open to any investor: no difference from accredited-only funds
Drawdown-fund benchmark fees in the decomposition: 1.5% a year for private credit, 2% for other strategies (moved from the slide, ME 2026-11-02)
Columbia Business School
Ewens and Faber · NHH 2026
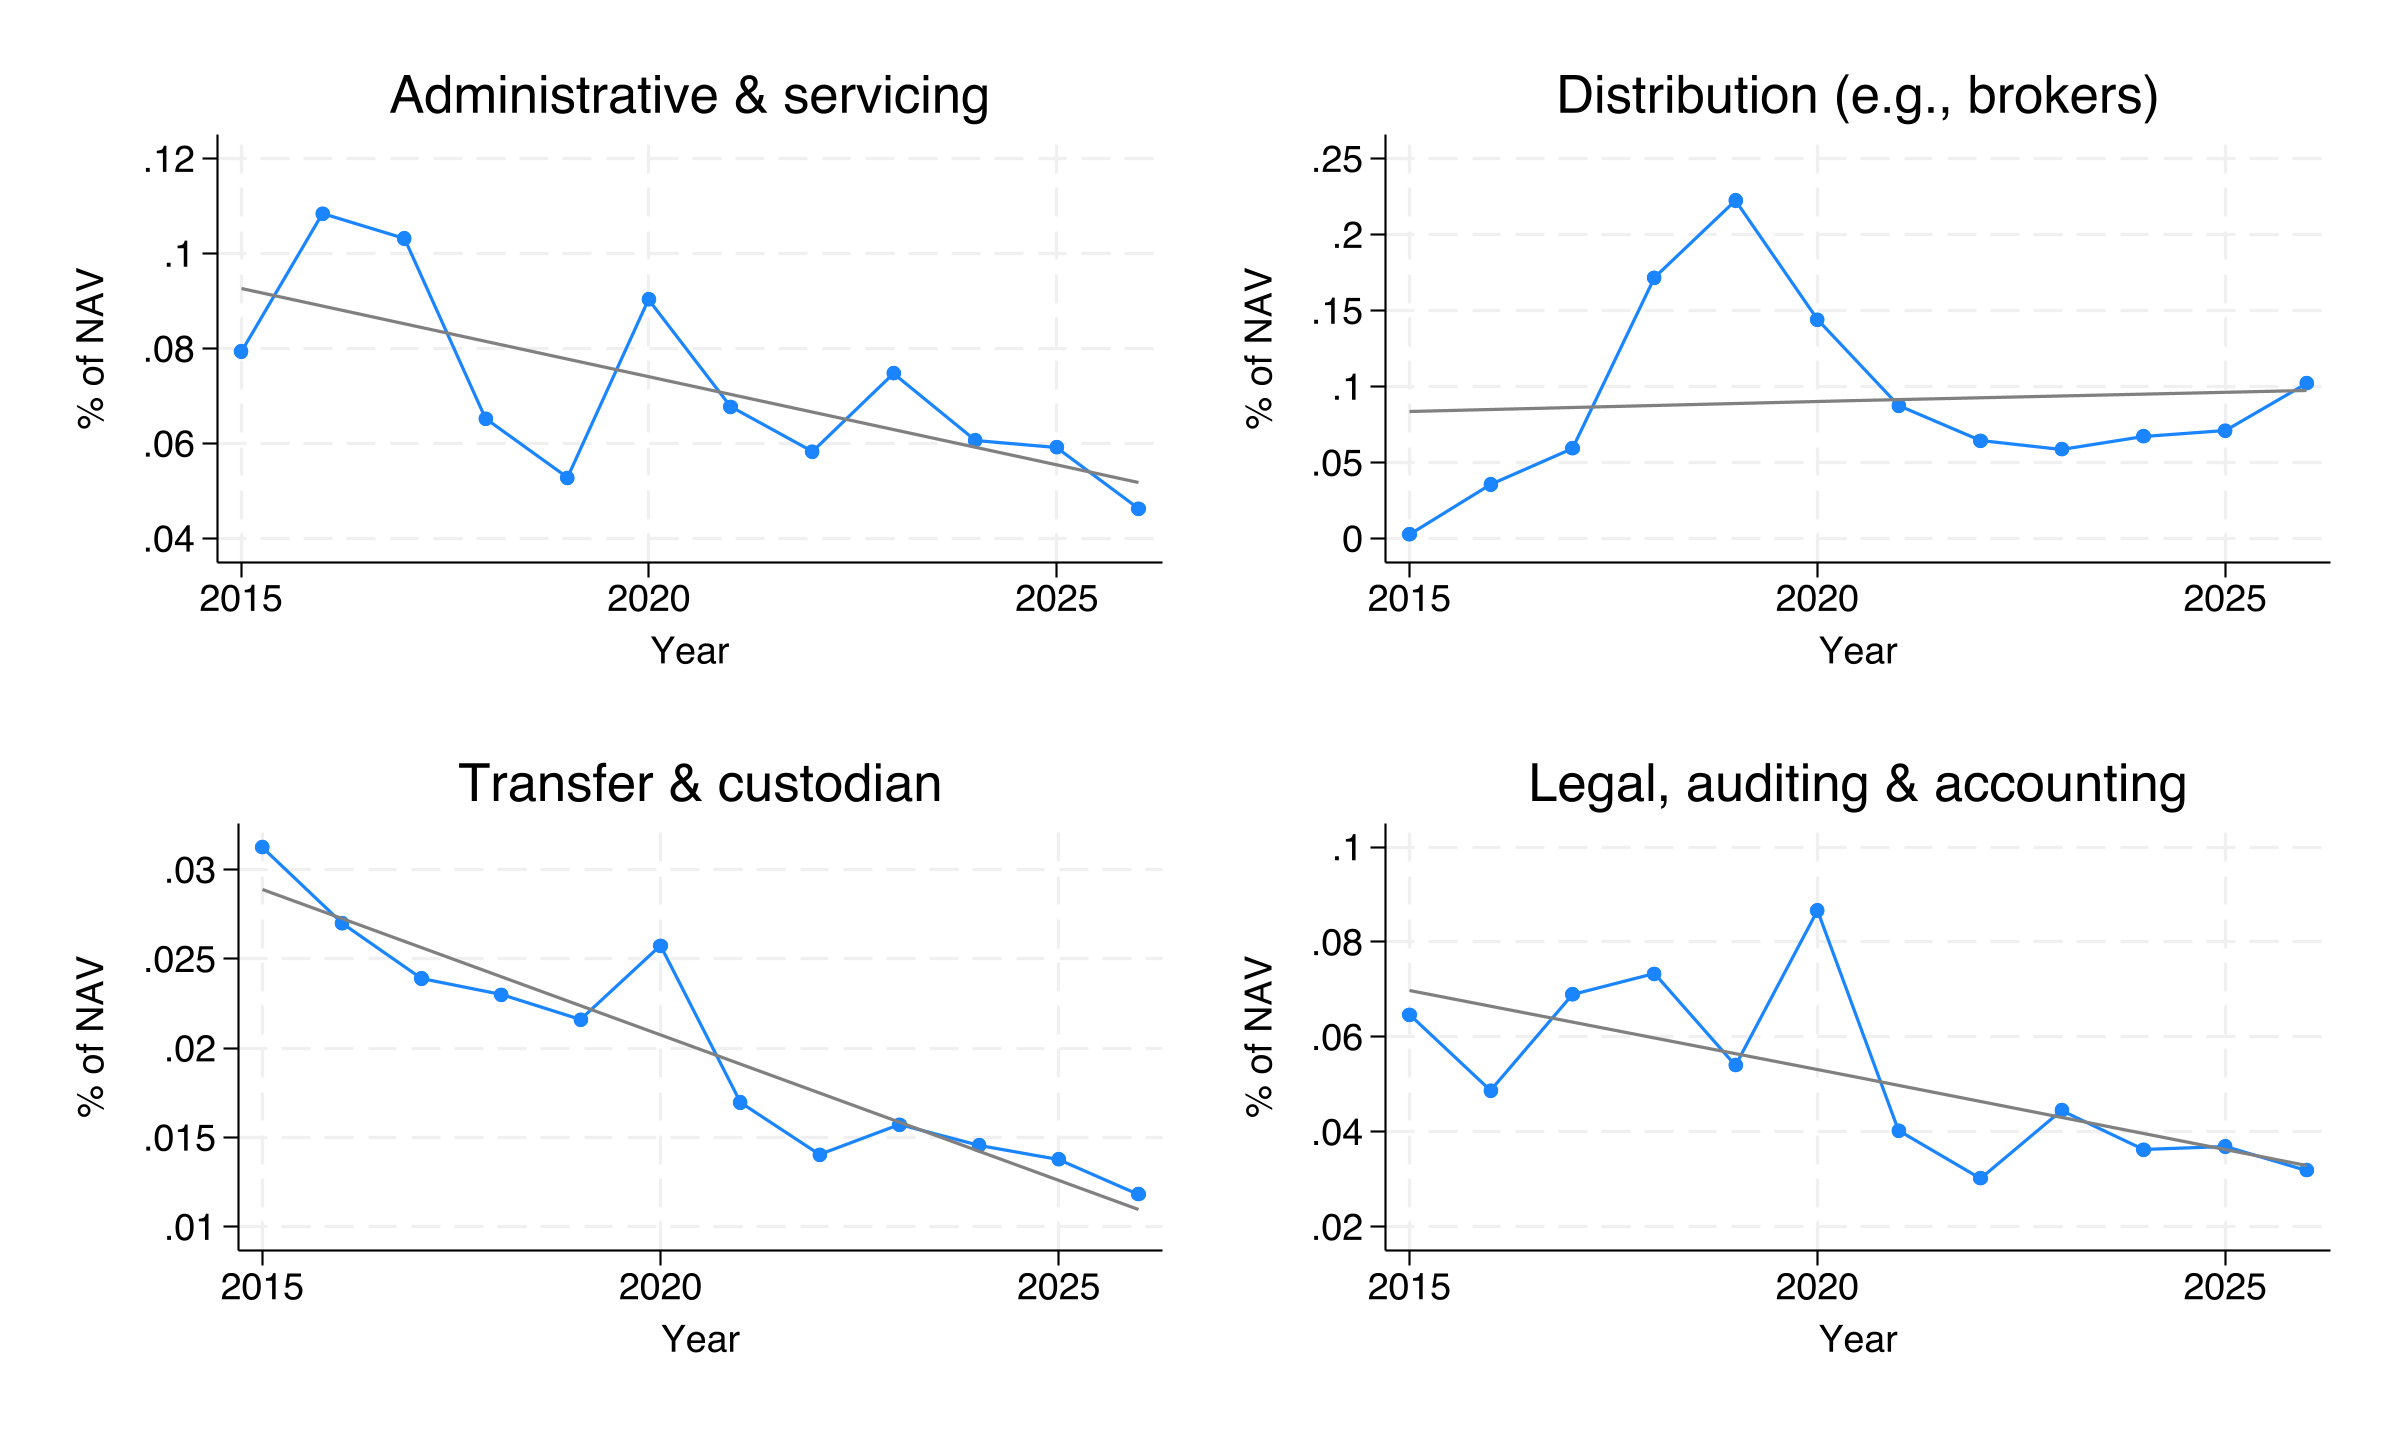
Fee gap likely to decline
Evidence the industry is already reaching some scale on expenses, and benefits of competition
Retirement capital will bring scale and bargaining power
Columbia Business School
Ewens and Faber · NHH 2026
Liquidity and retail access raise expenses
Recordkeeping and custody costs are about 45% higher for interval funds and for funds open to any investor
Interval funds also spend more on compliance
Larger funds spend less on almost every expense category
⇒ Providing liquidity to a large pool of investors raises expenses, and so fees; it goes with retail access
From the paper: Table 3 (fee determinants) and Table 4 (expense categories by fund characteristics); tables not shown
Columbia Business School
Ewens and Faber · NHH 2026
The benchmark and the simple gap
Benchmark: MSCI private-capital closed-end fund indexes (US Buyout, Private Credit, Venture Capital), capital-weighted for all strategies
From the raw performance gap: how much is a fee and cash-drag problem?
Wrapper fee: NAV-weighted, 3.24% a year for private credit and 2.79% for other strategies (the 2.5% fee slide is an equal-weighted fund-year mean; the fund-level table is a per-fund mean). Benchmark fee 0.45%/qtr (1.82% a year, blended 1.5% private credit / 2% other), charged on the invested share 93%: 0.42%/qtr. Cash drag = cash share 7.4% × benchmark return over T-bills 2.63%/qtr. TWO SETS OF NUMBERS. This slide is the NAV version, before any loadings: it credits the full benchmark fee on every invested dollar, as if the funds replicated the benchmark. Fees 0.32 (28%), cash 0.19 (17%), left 0.64 (55%). The preview and the conclusion use the ESTIMATED version (after loadings): fees 0.74 - 0.20 = 0.54 (47%), cash 0.19 (17%), exposure 0.41 (36%). The 0.64 falls to 0.41 because about 0.22 of it is benchmark fee credited on exposure the funds do not have: 0.45 × 93% × (1 - 0.46). WHY THE FEE CREDIT DEPENDS ON EXPOSURE: the institutional fee only comes with the part of the portfolio that copies the index. Loading 1: the wrapper only has to make up the fee difference (74 - 42 = 32 bp/qtr). Loading 0 (do our own thing): no fee credit, its own strategy must earn the whole fee (about 80 bp per invested dollar) just to match the index after fees. At 0.46 the credit is 20 bp, so 54 must come from its own returns. The further from replicating, the more of its fee it has to justify on its own. The total gap (-1.15) is the same either way; only the split between fees and exposure changes.
⇒ Assumes invested dollars replicate the benchmark. If imperfect, the 0.64 mixes exposure with whatever replaces it
Columbia Business School
Ewens and Faber · NHH 2026
Decomposing returns
Of each dollar of institutional private-market return, how much shows up in the wrapper?
Strip out what we already documented: add back the retail fee, take out the cash sleeve, gross up the rest
Public-market exposure
Private-market exposure (MSCI drawdown loading)
What is left is alpha: the gross retail premium
Columbia Business School
Ewens and Faber · NHH 2026
Return model estimates
All strategies
Private credit
Private equity
Venture capital
Alpha (gross retail premium, per quarter)
0.006
-0.002
0.010
0.012
(0.006)
(0.005)
(0.006)
(0.007)
Public market (excess)
0.173**
0.127**
0.012
0.363**
(0.066)
(0.048)
(0.070)
(0.125)
Private market: MSCI drawdown (excess)
0.465***
1.219***
0.598***
0.169
(0.076)
(0.254)
(0.094)
(0.098)
Cash + STIV share
7.37%
4.17%
9.19%
9.19%
Annual retail expense ratio
2.95%
3.24%
2.79%
2.79%
Observations
26
26
26
26
Adj. R-sq.
0.809
0.878
0.732
0.686
Quarterly regressions on fee-added, cash-stripped returns. Robust (HC1) standard errors in parentheses. * p<0.10, ** p<0.05, *** p<0.01
⇒ Every strategy trails its benchmark; in the pooled result, the private-exposure shortfall comes from PE and VC (private credit loads fully)
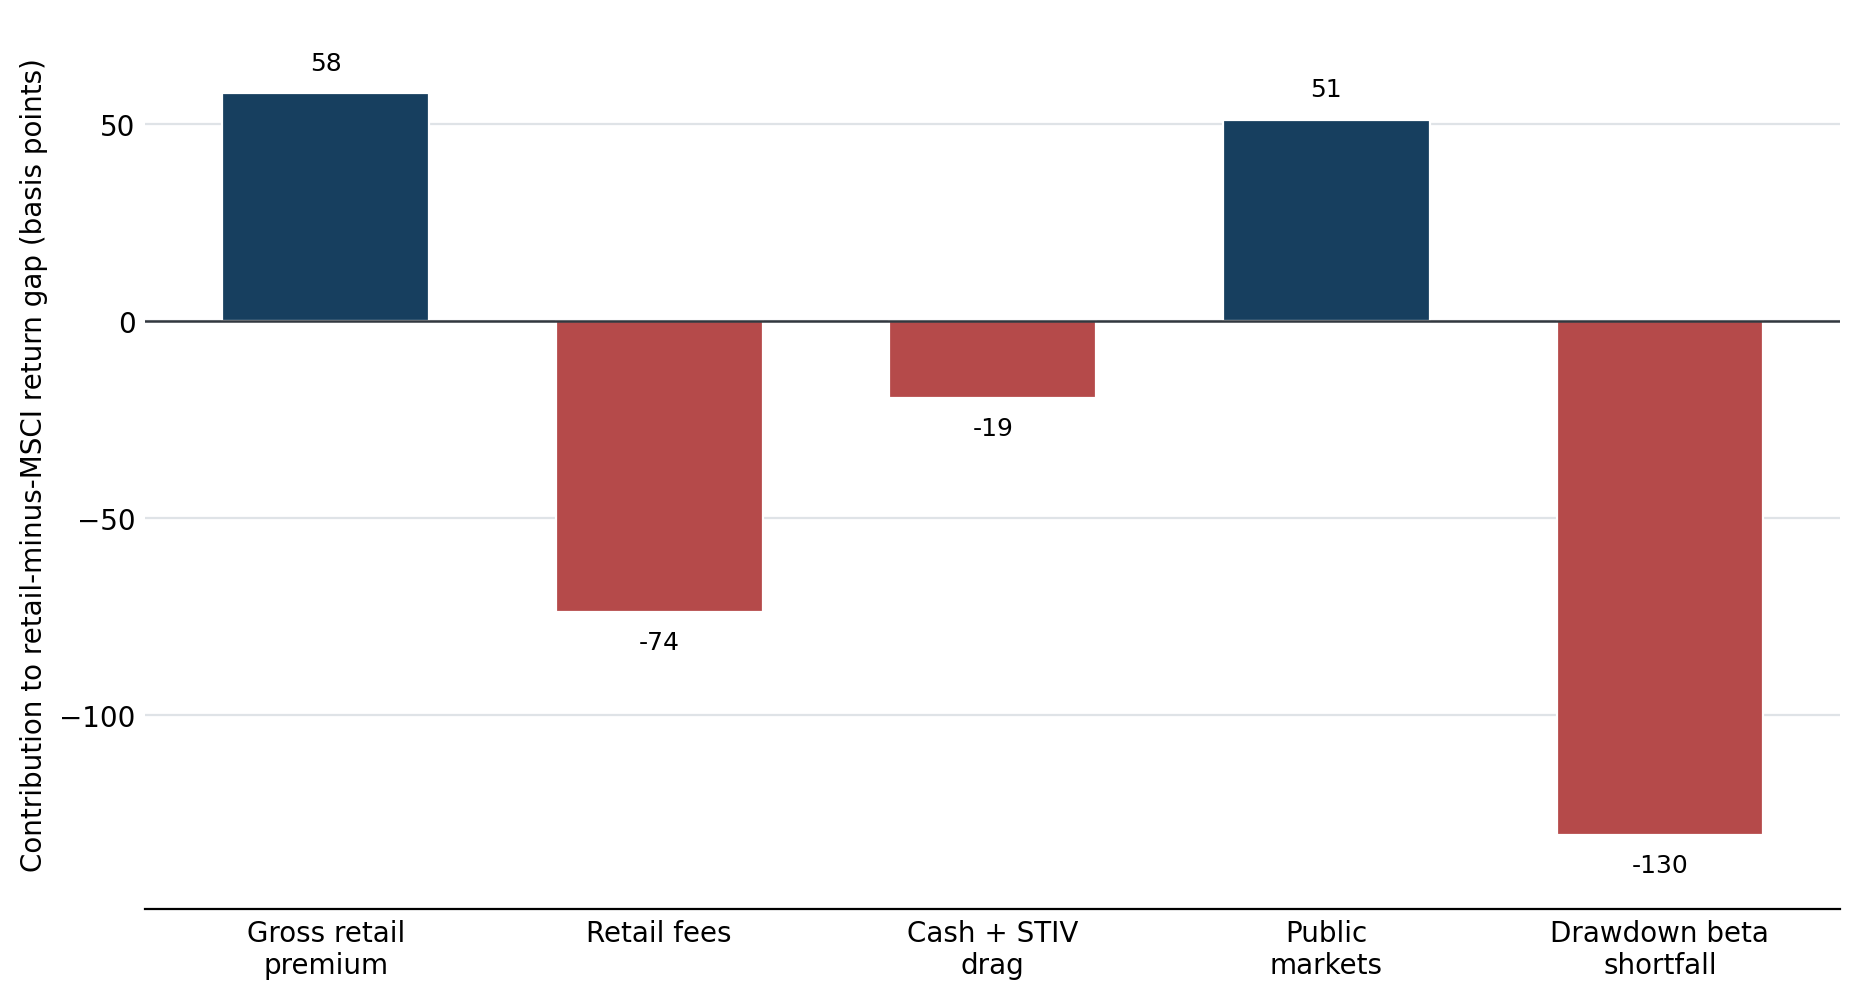
WHERE ALPHA COMES FROM (bp/qtr, over T-bills): invested money with the fee added back and cash removed averaged 240; stock market explains 0.17 × 318 = 55; private index explains 0.46 × 263 = 122; alpha = 63, × 93% invested = 58 on the waterfall. It is the constant (average unexplained return), not the residual (which averages zero); positive in 21 of 26 quarters. Cautions: (1) it is about the size of the fee we added back (about 80 bp per invested dollar), so net of fees investors keep roughly nothing (-17): a gross premium, not skill; (2) not significant (0.006, s.e. 0.006); (3) it trades off with the private loading. JOINT ESTIMATION: stock market and MSCI are correlated 0.72; each loading holds the other fixed. MSCI alone: 0.70; stock market alone: 0.35 (alpha 0.013). So the -130 shortfall and +51 public bars belong together; the three regression bars always sum to -21.
Columbia Business School
Ewens and Faber · NHH 2026
Decomposing the gap
Exposure shortfall = (share of the portfolio invested) × (missing exposure) × (what the benchmark paid over cash)
Components (bp/qtr, all strategies): gross retail premium = alpha plus residual on the non-cash share; retail fees = reported expense ratio; cash drag = -w_c(r^D - r^f); public markets = loading on the market; drawdown-beta shortfall = (1 - w_c)(beta_D - 1)(r^D - r^f). Components sum to the gap every quarter. HOW TO EXPLAIN IT (ME 2026-11-03): every bar is measured against what an investor in the index earns AFTER the index fees, so the benchmark fee never gets its own bar and the wrapper fee bar is the whole 74. Cash -19 = 7.4% of NAV × the index return over T-bills (263 bp/qtr): what the liquid money gives up (positive in down quarters, e.g. 2020Q1; untested in a downturn). Exposure -130 = 93% invested × (0.46 - 1) × 263; on the index before fees (308) it would be -153, the 23 bp difference is benchmark fee not owed on exposure not delivered. Offsets: stock market +51, gross premium +58. Spoken: each bar vs what an index investor earns after fees; the whole wrapper fee costs 74, cash 19, the invested money tracks only half the index (130); stocks give back 51 and a premium 58. Versus slide 28 (simple gap): that slide credits 42 bp of benchmark fee up front, so its 0.64 = 0.21 here + 0.42. Perfect replication thought experiment: gap would be fee difference + cash = 0.32 + 0.19 = 0.51/qtr (about 2 pts/yr).
Columbia Business School
Ewens and Faber · NHH 2026
Measurement issues and NAV smoothing
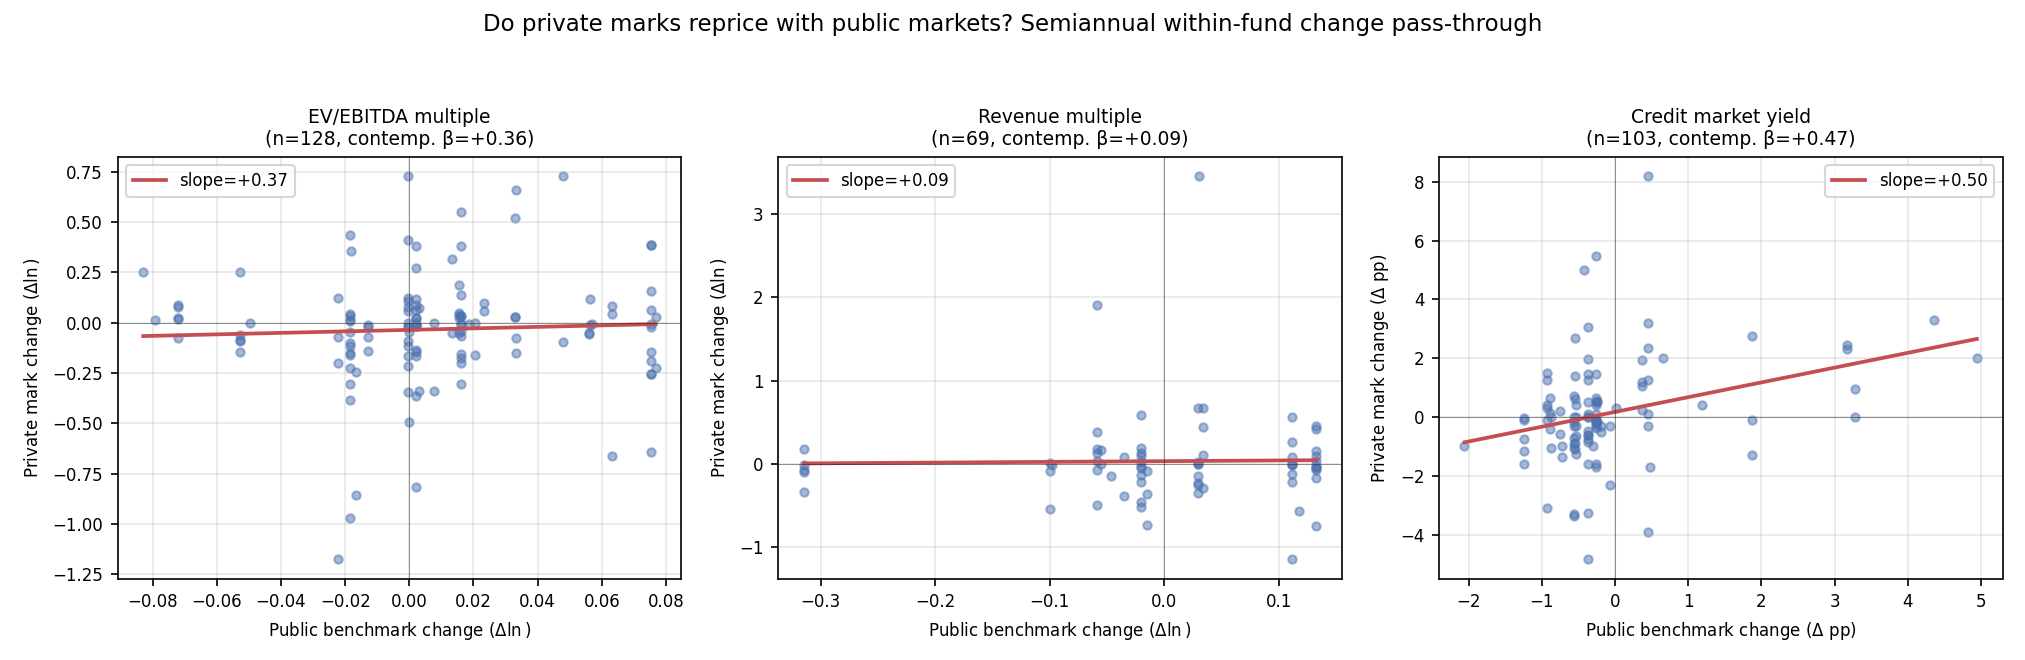
Smoothed NAVs bias betas down
Autocorrelation of quarterly returns, 2019q3–2026q1
Lag 1
Lag 2
Retail funds: all strategies
-0.09
0.07
Retail funds: private credit
-0.22
0.03
MSCI combined private-capital index
0.49
0.37
MSCI US Buyout
0.41
0.30
MSCI US Venture Capital
0.70
0.51
Quarterly retail fund returns show no smoothing; the drawdown benchmark is the smoothed series
Adjusting for lags barely moves the drawdown beta (0.41 → 0.46)
Autocorrelations: paper table tab:smooth_lit_acf Panel A (out_new/smooth_lit_A.tex). Drawdown beta: tab:dimson_summary Panel B, all strategies, unadjusted 0.414, 2-quarter lags 0.464, symmetric window 0.346 (net returns, before the fee and cash adjustment; the waterfall uses the adjusted model). Smoothing in the benchmark makes it look less risky and lag; expect the question.
Columbia Business School
Ewens and Faber · NHH 2026
Two-sided liquidity
The fund sample
Decomposition
Two-sided liquidity
Incentives and governance
Retail is not institutional
Does manager experience matter?
Conclusion
Columbia Business School
Ewens and Faber · NHH 2026
Deployment risk
The traditional drawdown fund has committed capital
→ manager asks for capital when a deal is available
These wrappers are evergreen with daily/monthly subscriptions
Inflows at the whim of investors, not deal flow
Enter: deployment risk
Inflows must sit in cash while waiting for deals
Or managers deploy in suboptimal investments
Columbia Business School
Ewens and Faber · NHH 2026
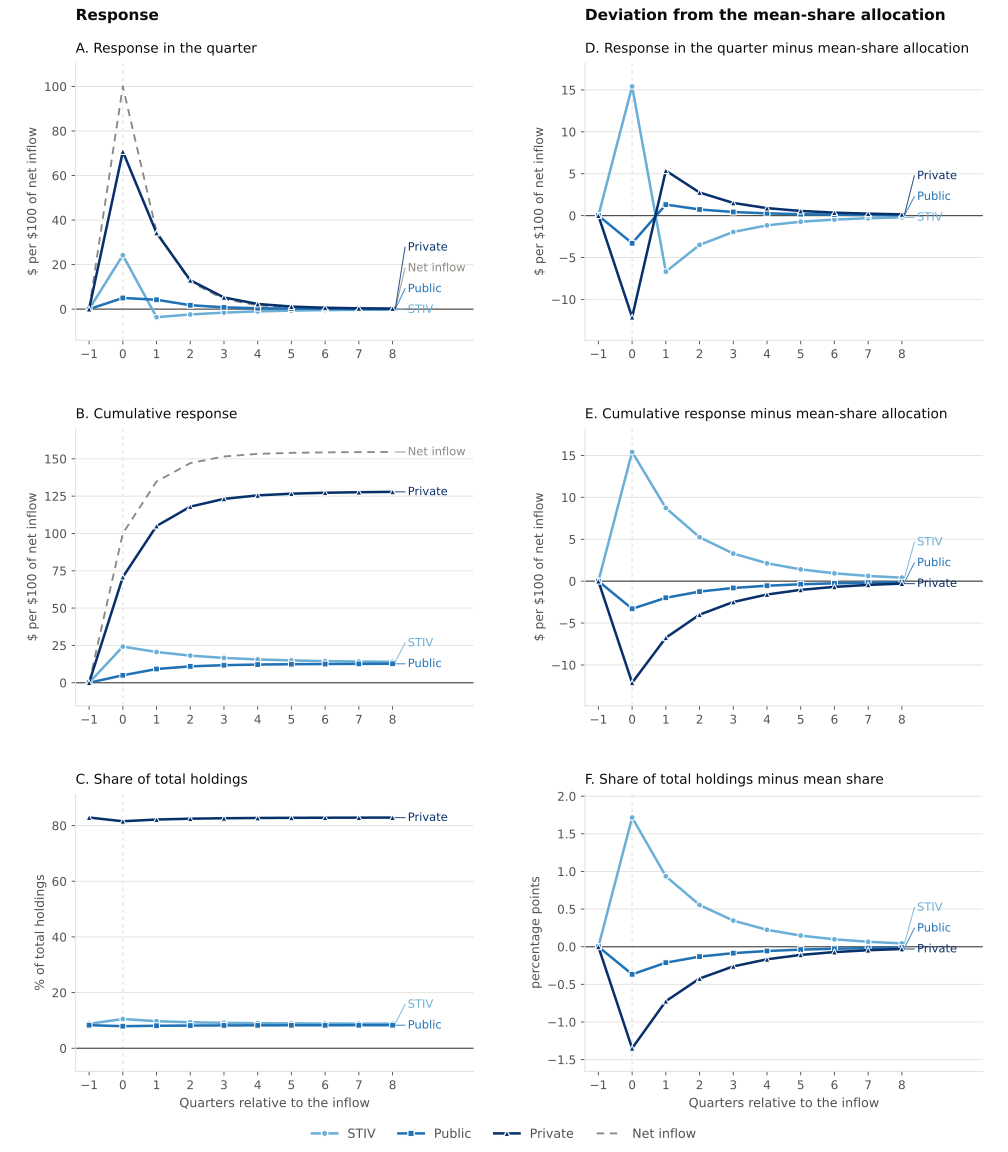
The deployment test
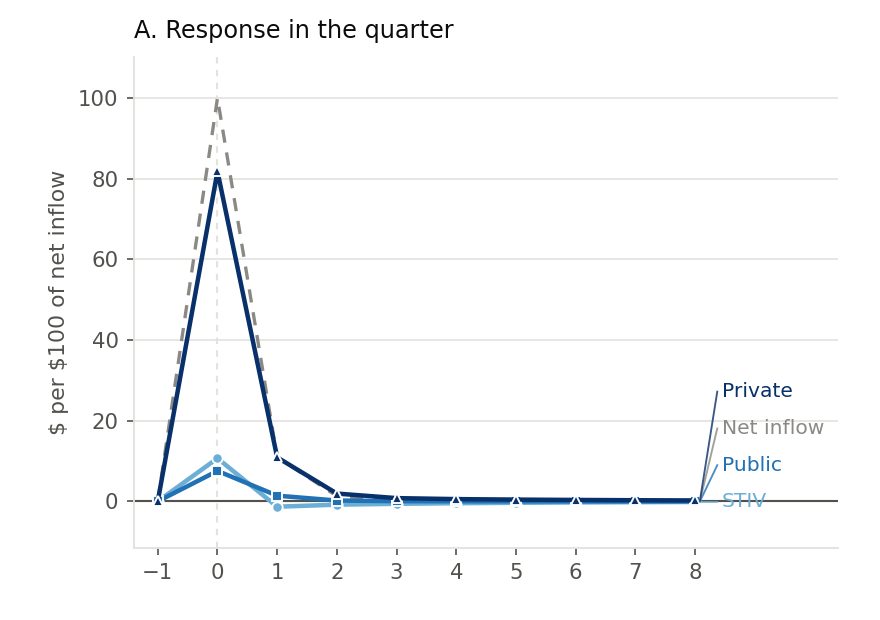
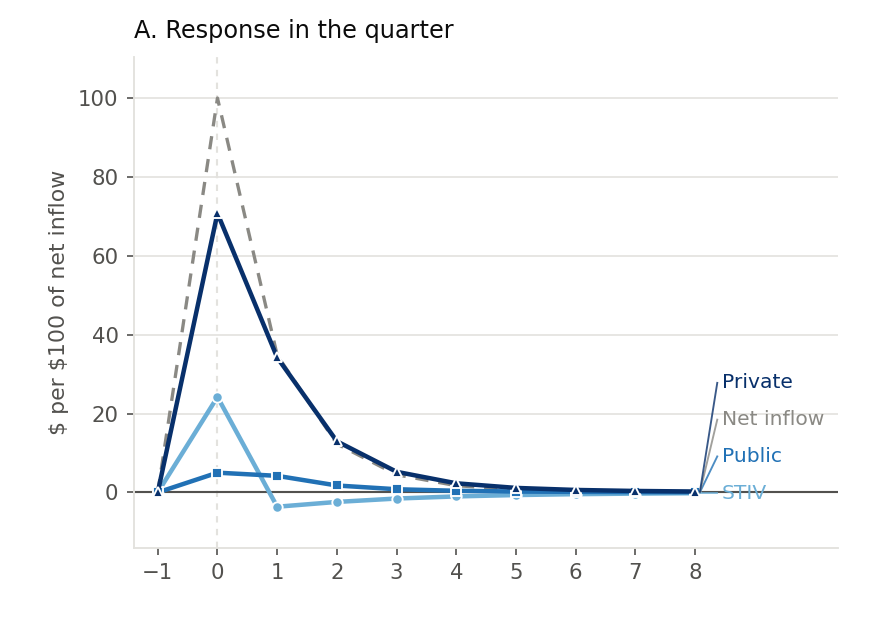
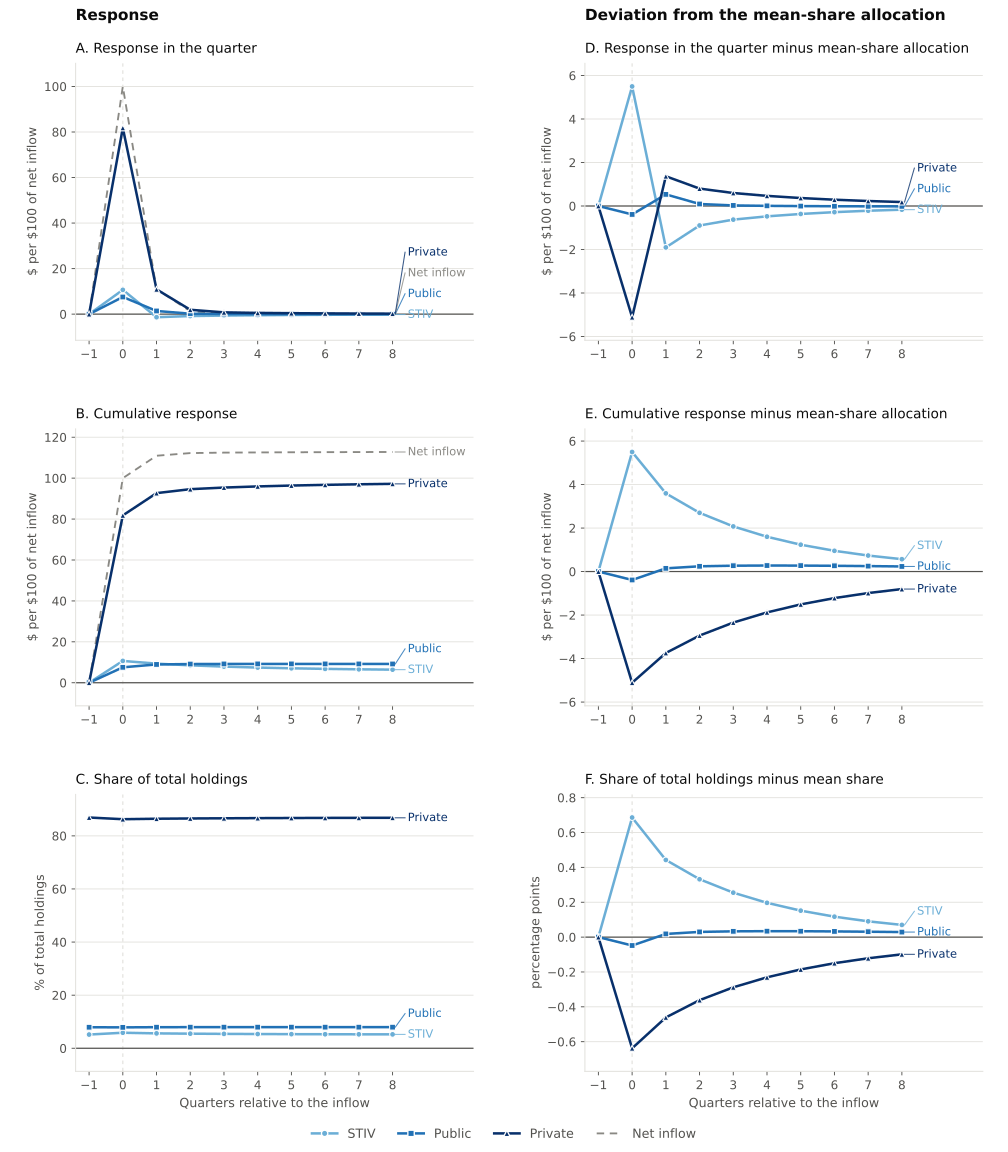
Thought experiment: a fund receives a $100 net inflow. How much reaches private assets, and how fast?
f: net inflow / lagged NAV sx: share of holdings in x = cash, public, private αt: quarter fixed effects; γ0x: same-quarter deployment of an inflow
Then trace a typical fund (average shares) after the inflow and compare its private holdings with its average private share of the inflow
From the paper: tab:deployment_var (first-order VAR of net inflow / lagged NAV and the three holdings shares; net inflow ordered first; quarter FE for private credit, quarter x fund-type FE otherwise; SE clustered by quarter) and fig:deployment_var_pc / _nonpc (response of a representative fund at the mean shares, $100 = the average quarterly inflow).
Columbia Business School
Ewens and Faber · NHH 2026
Where does a $100 inflow go?
Private credit
94% of the target private allocation in the quarter, 97% two quarters later
Other strategies
85% in the quarter, 97% two quarters later
Panel A of the paper figures (response in the quarter, $ per $100 of net inflow; dashed line = net inflow incl. predicted follow-on inflows). Percentages: private dollars as % of the pre-inflow private share times inflow so far (computed from export_deployment_var.estimate, 2026-11-01). Full six-panel figures in Backup.
Columbia Business School
Ewens and Faber · NHH 2026
How do investors respond to performance?
Inflows respond to performance, starting the next quarter
A return one standard deviation higher (15 pp) adds 1.9% of NAV to next quarter’s inflows
For scale: the average quarter’s inflow is 8.7% of NAV
Net inflow / lagged NAV
(1)
All funds
Return t-1
0.123***
(0.031)
Return t-2
0.093***
(0.028)
Return t-3
0.064
(0.040)
Year-quarter FE
Yes
Strategy FE
Yes
N
1,456
Funds
130
Adj. R-sq.
0.088
Standard errors clustered by fund in parentheses
* p<0.10, ** p<0.05, *** p<0.01
Columbia Business School
Ewens and Faber · NHH 2026
Exit pressures
Columbia Business School
Ewens and Faber · NHH 2026
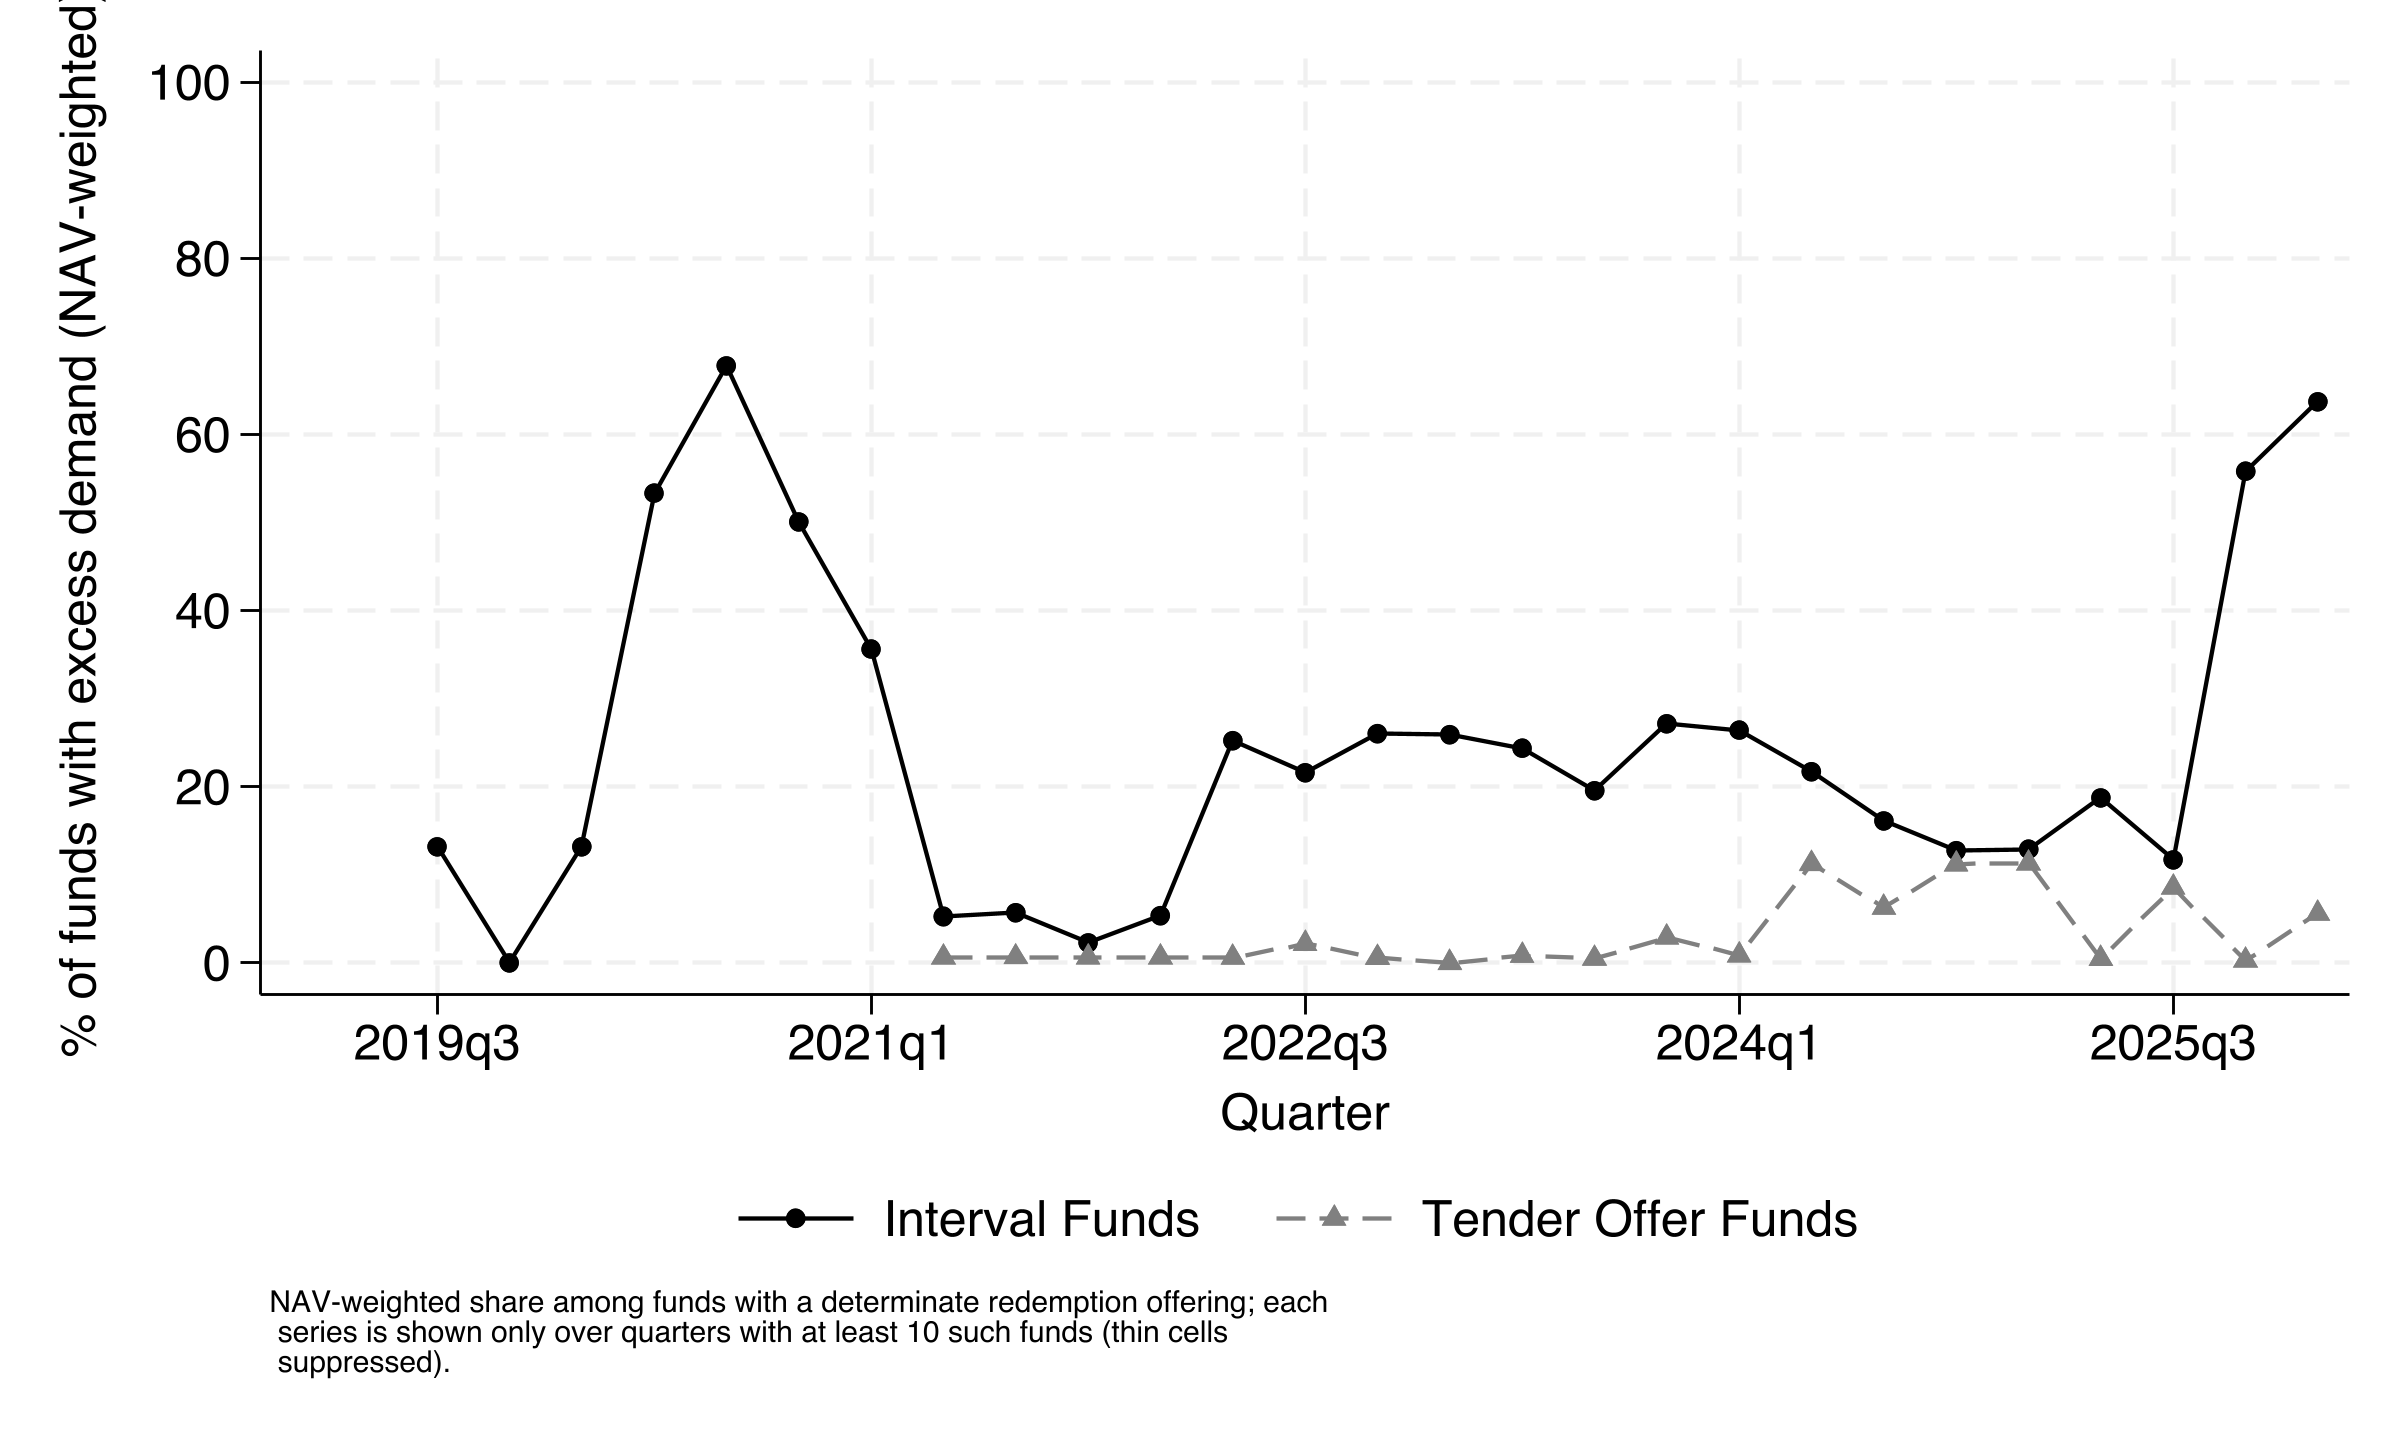
Excess demand events
Share of funds where sales > offered shares
Pressure rising in the last two quarters
Two spikes in interval-fund NAV with excess demand: 2020 (up to 68%) and the last two quarters (56–64%)
Inflows have kept pace with redemptions
Columbia Business School
Ewens and Faber · NHH 2026
Are funds good at selecting assets?
Research (e.g., Sorensen, 2008) documents that deal flow is a critical reason some GPs outperform:
Wrappers’ ability to replicate deal flow is unclear
Often purchase on the secondary market
Often connected to large asset managers and thus some deal flow
Columbia Business School
Ewens and Faber · NHH 2026
Are these funds buying lemons?
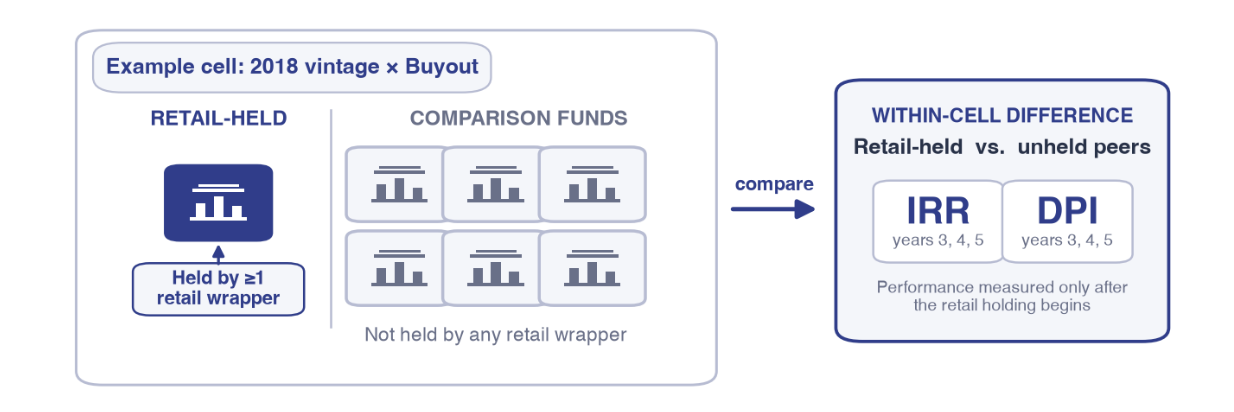
Test: compare the fund positions in the wrappers with those not selected but raised in the same year with the same strategy
Columbia Business School
Ewens and Faber · NHH 2026
Which funds do the wrappers hold?
Log fund size
First-time fund
Log years to close
(1)
(2)
(3)
Held in a retail fund
0.87***
0.044***
0.19**
(0.085)
(0.017)
(0.088)
Vintage × category FE
Yes
Yes
Yes
Investor FE
Yes
Yes
Yes
Excl. secondary purchases
Yes
Yes
Yes
Observations
4,784
4,801
3,019
Standard errors clustered by fund in parentheses. * p<0.10, ** p<0.05, *** p<0.01
Retail-held funds are larger
More likely to be first-time funds, and took longer to close
⟹ Clear preference for larger funds and funds that likely struggled to close
Paper table tab:selection, Panel A (out_new/selection_panelA_v2.tex): drawdown funds held by at least one retail vehicle vs. funds of the same vintage and strategy not held. Columns add vintage x category FE, then investor (GP) FE, then exclude secondary purchases.
Columbia Business School
Ewens and Faber · NHH 2026
No worse returns, but higher DPI (thus far)
Funds in retail wrappers have similar IRRs to those investments passed on
But, their cash flow arrives earlier (year 3)
⟹ Some evidence the private assets tilt to the more liquid
IRR yr 3
IRR yr 4
IRR yr 5
DPI yr 3
DPI yr 4
DPI yr 5
(1)
(2)
(3)
(4)
(5)
(6)
Held in a retail fund
0.56
-0.30
1.00
0.093***
0.052
0.030
(2.70)
(1.91)
(1.82)
(0.034)
(0.045)
(0.051)
Vintage × category FE
Yes
Yes
Yes
Yes
Yes
Yes
Investor FE
Yes
Yes
Yes
Yes
Yes
Yes
Excl. secondary purchases
Yes
Yes
Yes
Yes
Yes
Yes
Observations
3,392
3,305
3,062
3,525
3,359
3,090
Standard errors clustered by fund in parentheses. * p<0.10, ** p<0.05, *** p<0.01
Columbia Business School
Ewens and Faber · NHH 2026
Incentives and governance
The fund sample
Decomposition
Two-sided liquidity
Incentives and governance
Retail is not institutional
Does manager experience matter?
Conclusion
Columbia Business School
Ewens and Faber · NHH 2026
What replaces the partnership agreement?
Drawdown fund (LPA)
Committed capital ties the GP’s hands
Limited life: a new fund every 3–5 years, so fundraising discipline
LP advisory committee
GP stake about 1% of commitments, plus carry
Retail wrapper
Capital arrives daily to monthly
No fundraising cycle
Boards and Rule 2a-5 valuation oversight
Manager ownership and Section 205 contract
Columbia Business School
Ewens and Faber · NHH 2026
Incentive fees: less common than drawdowns
Nearly all drawdown funds have 20% profit sharing for managers
Profit sharing is legally prohibited for many retail-facing vehicles
Most private credit charge on income
Basis the incentive fee is charged on
Net investment income
Capital gains / NAV
(1)
(2)
Funds
34
25
Median incentive rate (contractual)
15.0%
10.0%
Median realized fee, % of NAV
0.94%
1.61%
Share with a hurdle
97%
20%
Median hurdle rate
6.0%
6.0%
Share with a catch-up
91%
8%
Share with loss-recovery or high-water
3%
88%
Share private credit
100%
4%
Share open to any investor
68%
0%
Median minimum investment
$7,500
$50,000
Columbia Business School
Ewens and Faber · NHH 2026
Manager skin-in-the-game
Mutual funds: ~43% of managers own stakes, about 0.04% of assets
Drawdown funds: GPs commit ~1%, plus carry
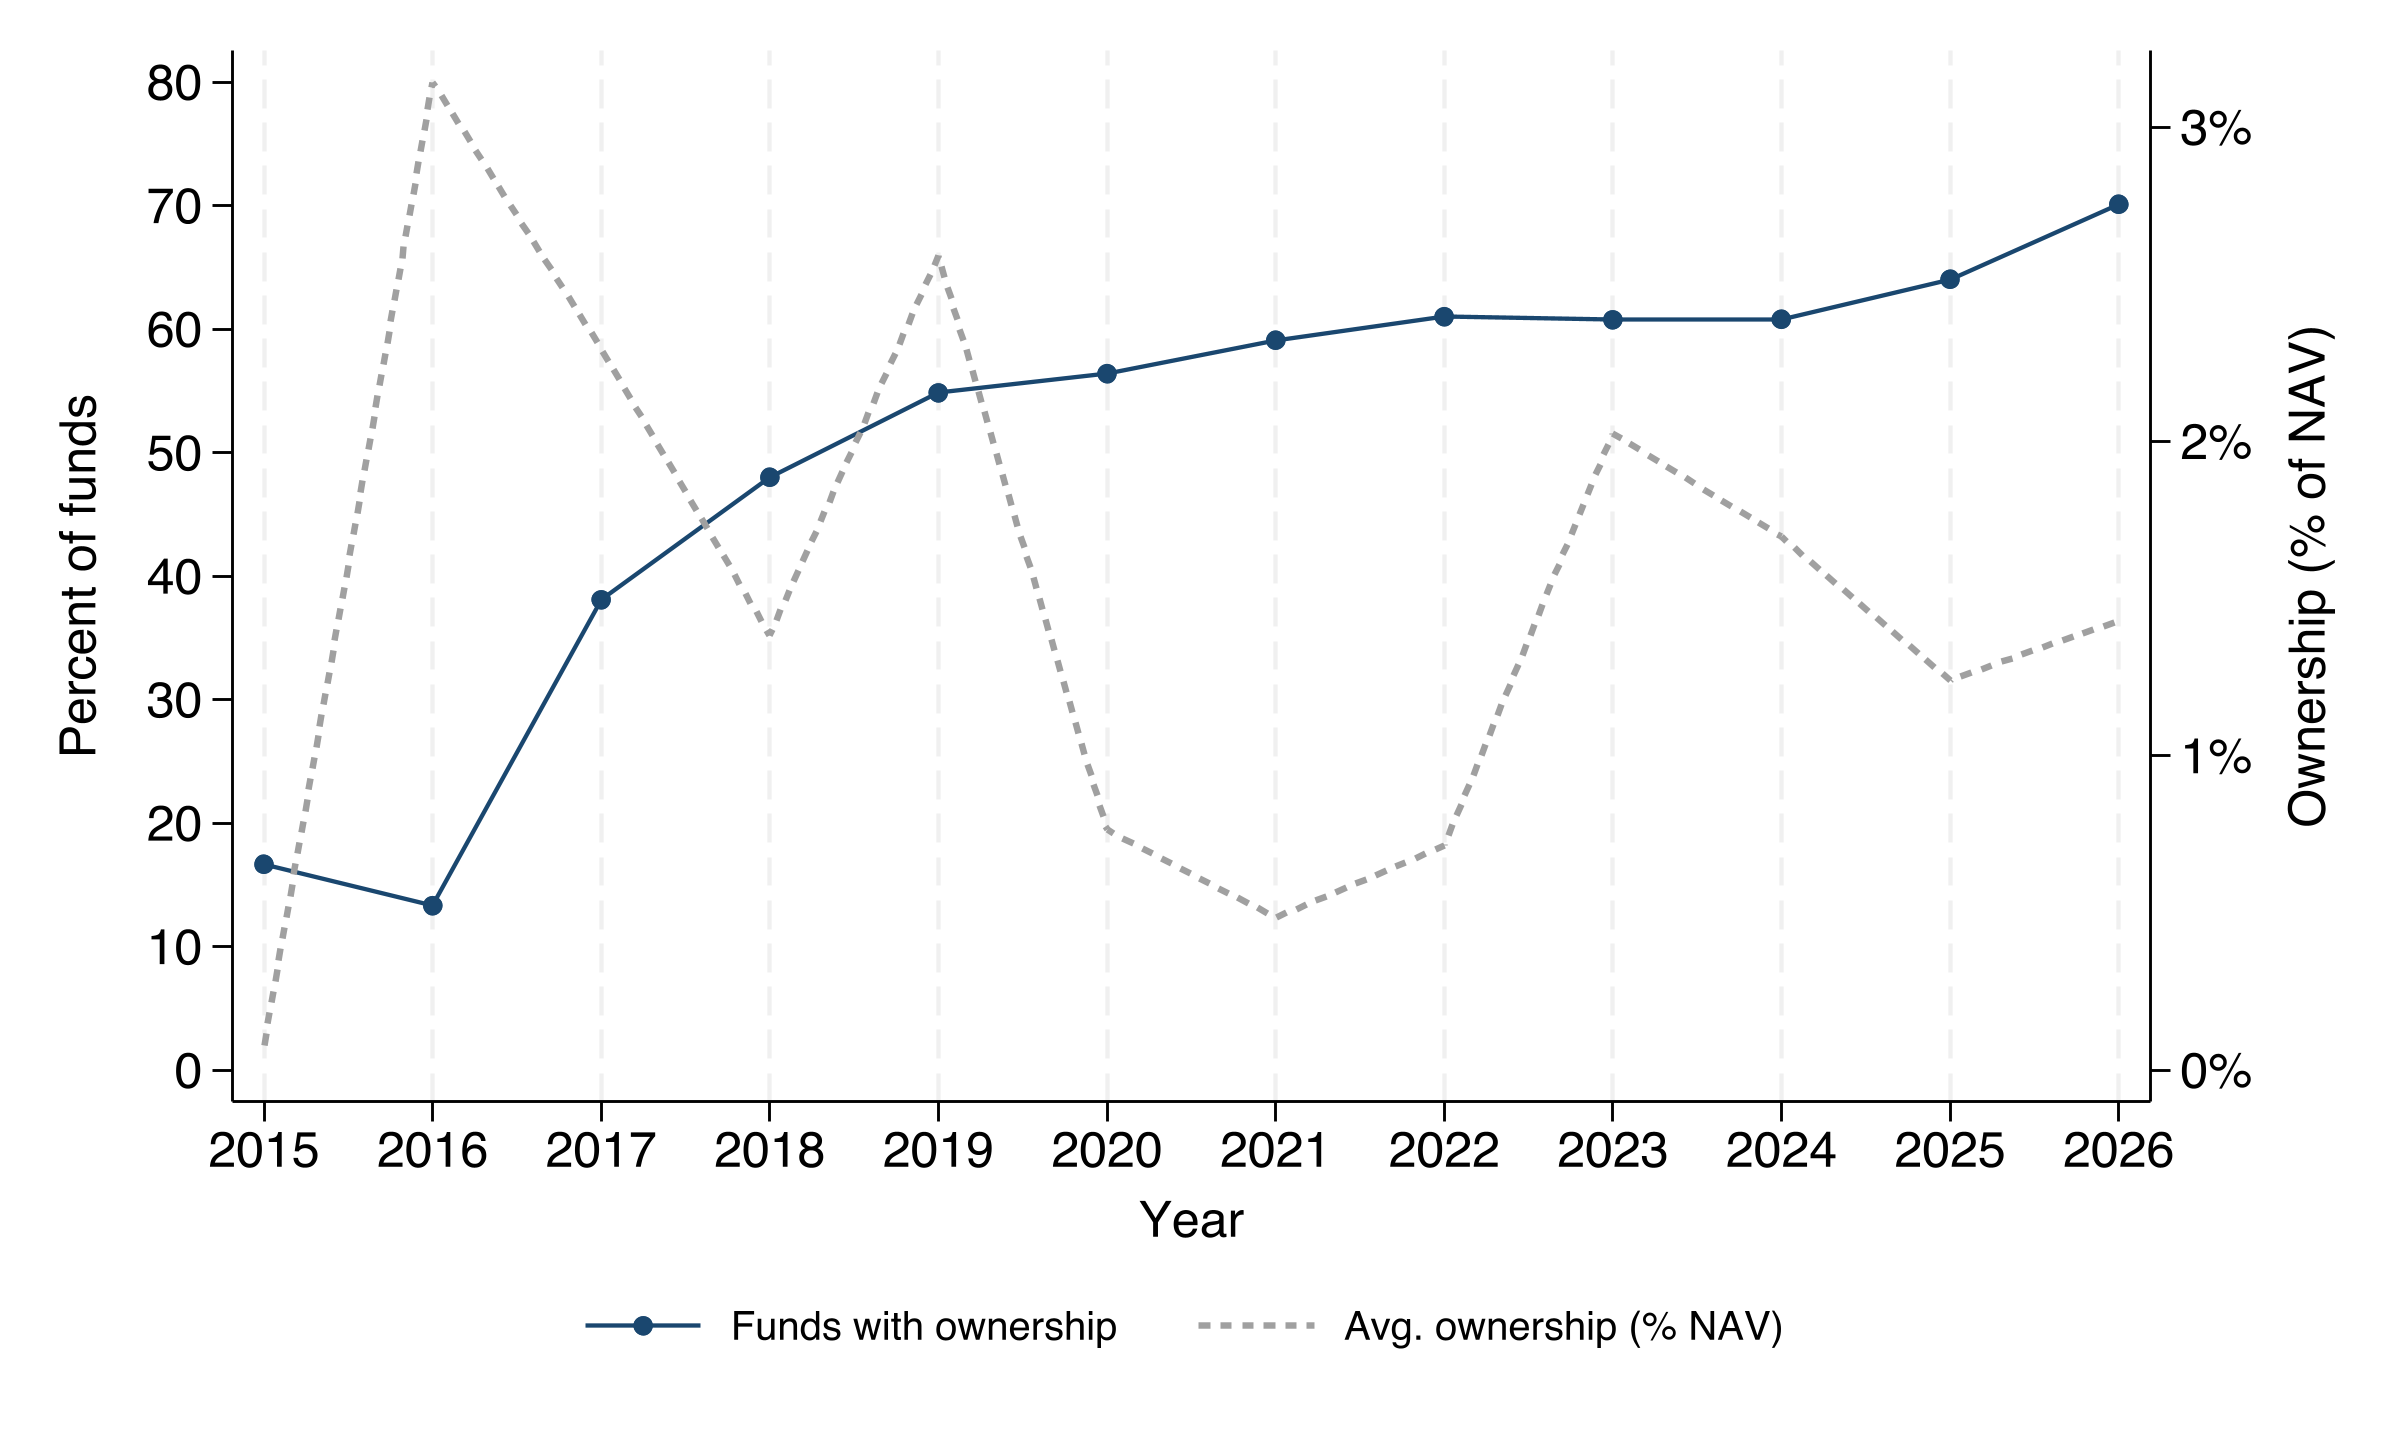
Retail wrappers: most funds (about 60–70%) report manager ownership, averaging about 1.5% of NAV
Columbia Business School
Ewens and Faber · NHH 2026
Do incentives and governance matter?
Asset-gathering incentives: fees on manager-marked NAV
Weak evidence that funds with incentive pay and skin in the game have higher returns relative to the benchmark
No relation between board independence and returns
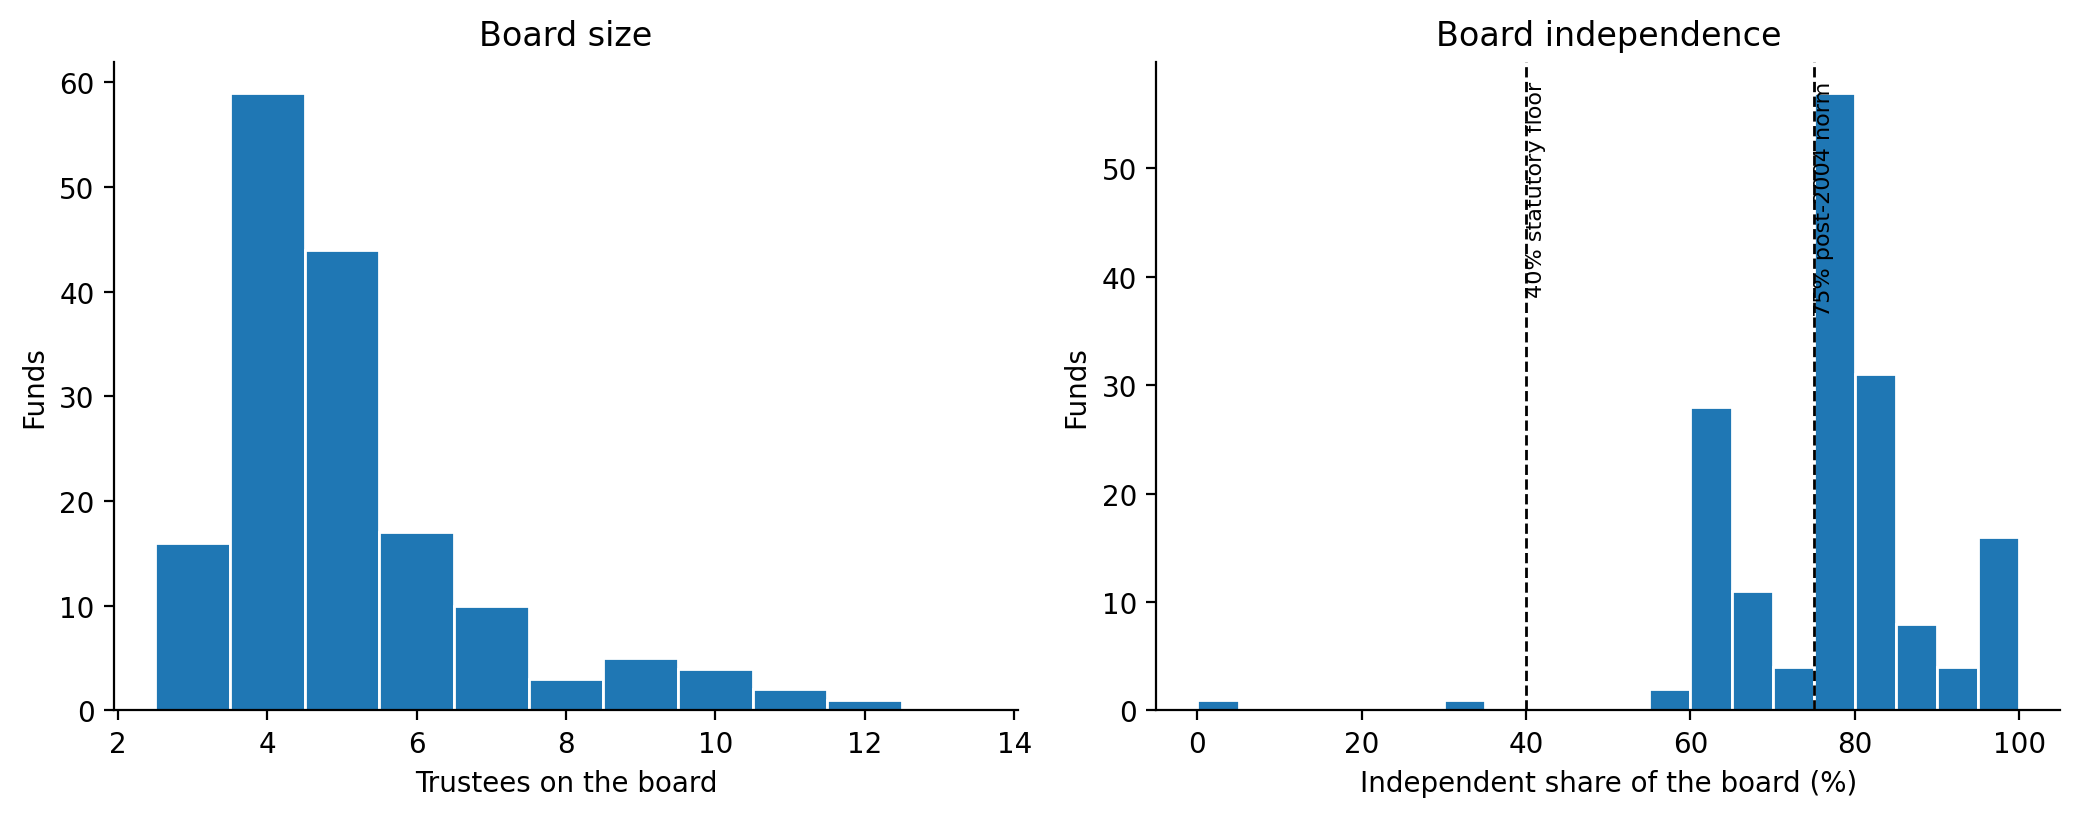
Likely because there is not much variation: a third of boards sit at exactly 75% independent
We explore this further in the analysis of manager skill and experience
⇒ Connecting differences in governance and incentives to the gap is challenging and a work in progress
Fund-quarter regressions, year-quarter and strategy FE, log lagged NAV, SE clustered by fund (output/talk_incentive_v1). Excess return over strategy MSCI, pp per quarter, alone / joint: stake any 0.25 (0.33) / 0.22 (0.34); stake % NAV 0.057* (0.032) / 0.053 (0.033); incentive fee 0.47 (0.33) / 0.31 (0.32). Joint N = 1,787 fund-quarters, 149 funds. Ownership is the latest report applied to all quarters; incentive fees concentrated in private credit. Board independence (latest roster, 157 funds): independent share -0.008 (0.019) on MSCI-adjusted return; above-75% indicator -0.948 (0.378) but 53 of 157 funds sit exactly at the 75% median and no board-size control.
Low savings, often retirement savings, responsive to performance
Invest through
Pensions, endowments
Private banks, wealth advisors
Brokers, 401(k) plans
Liquidity needs
Long horizons, known cash needs
Between the two
May redeem at any time
Information and due diligence
Staff, consultants, LP advisory seats
Between the two
Brokers and advisors, limited due diligence
Previous outline: “Retail” = accredited and non-accredited; Others are institutions and QP
Columbia Business School
Ewens and Faber · NHH 2026
Do retail investors chase performance?
Funds that allow any investors are less performance-sensitive
Net inflow / lagged NAV
(1)
(2)
Open to indiv.
Accred./Qual.
Return t-1
0.038
0.194***
(0.033)
(0.043)
Return t-2
0.036
0.140***
(0.036)
(0.051)
Return t-3
0.086
0.054
(0.075)
(0.051)
Year-quarter FE
Yes
Yes
Strategy FE
Yes
Yes
N
643
813
Funds
58
72
Adj. R-sq.
0.058
0.120
Standard errors clustered by fund in parentheses
* p<0.10, ** p<0.05, *** p<0.01
Columbia Business School
Ewens and Faber · NHH 2026
Is this retail running for the doors? (No)
No evidence that retail investors or retail-focused funds experience more sales pressure
Redemption rate = shares redeemed / shares at the start of a six-month period
(1)–(2): institutional vs. direct-retail share classes, same fund and period (fund × period FE)
(3)–(4): below-median-retail funds vs. more-retail funds (period and structure FE)
Channel level
Fund level
(1)
(2)
(3)
(4)
vs. ED
vs. return
vs. ED
vs. return
Institutional
0.009
0.020*
(0.006)
(0.010)
Institutional × Excess demand
0.005
(0.022)
Institutional × Return t-1
-0.008
(0.077)
Below-median retail
-0.016**
-0.012
(0.007)
(0.008)
Below-median retail × Excess demand
0.017
(0.014)
Below-median retail × Return t-1
-0.146
(0.115)
Fixed effects
Fund-period
Fund-period
Period+struct.
Period+struct.
N
132
90
193
110
Funds
19
14
71
50
Adj. R-sq.
0.473
0.414
0.430
0.227
Standard errors clustered by fund in parentheses
* p<0.10, ** p<0.05, *** p<0.01
Columbia Business School
Ewens and Faber · NHH 2026
Is retail to blame? Mostly not
Funds open to any investor chase performance less: 0.04 per point of last quarter’s return (not significant) vs. 0.19*** for accredited-only funds
No evidence retail investors run for the doors
But investors sort into strategies by the inclusion rules: private credit is mostly open to any investor (55 of 79 funds), PE mostly accredited-only (20 of 25)
⇒ Retail demand and behavior are not that bad
Columbia Business School
Ewens and Faber · NHH 2026
Are retail investors selecting bad managers?
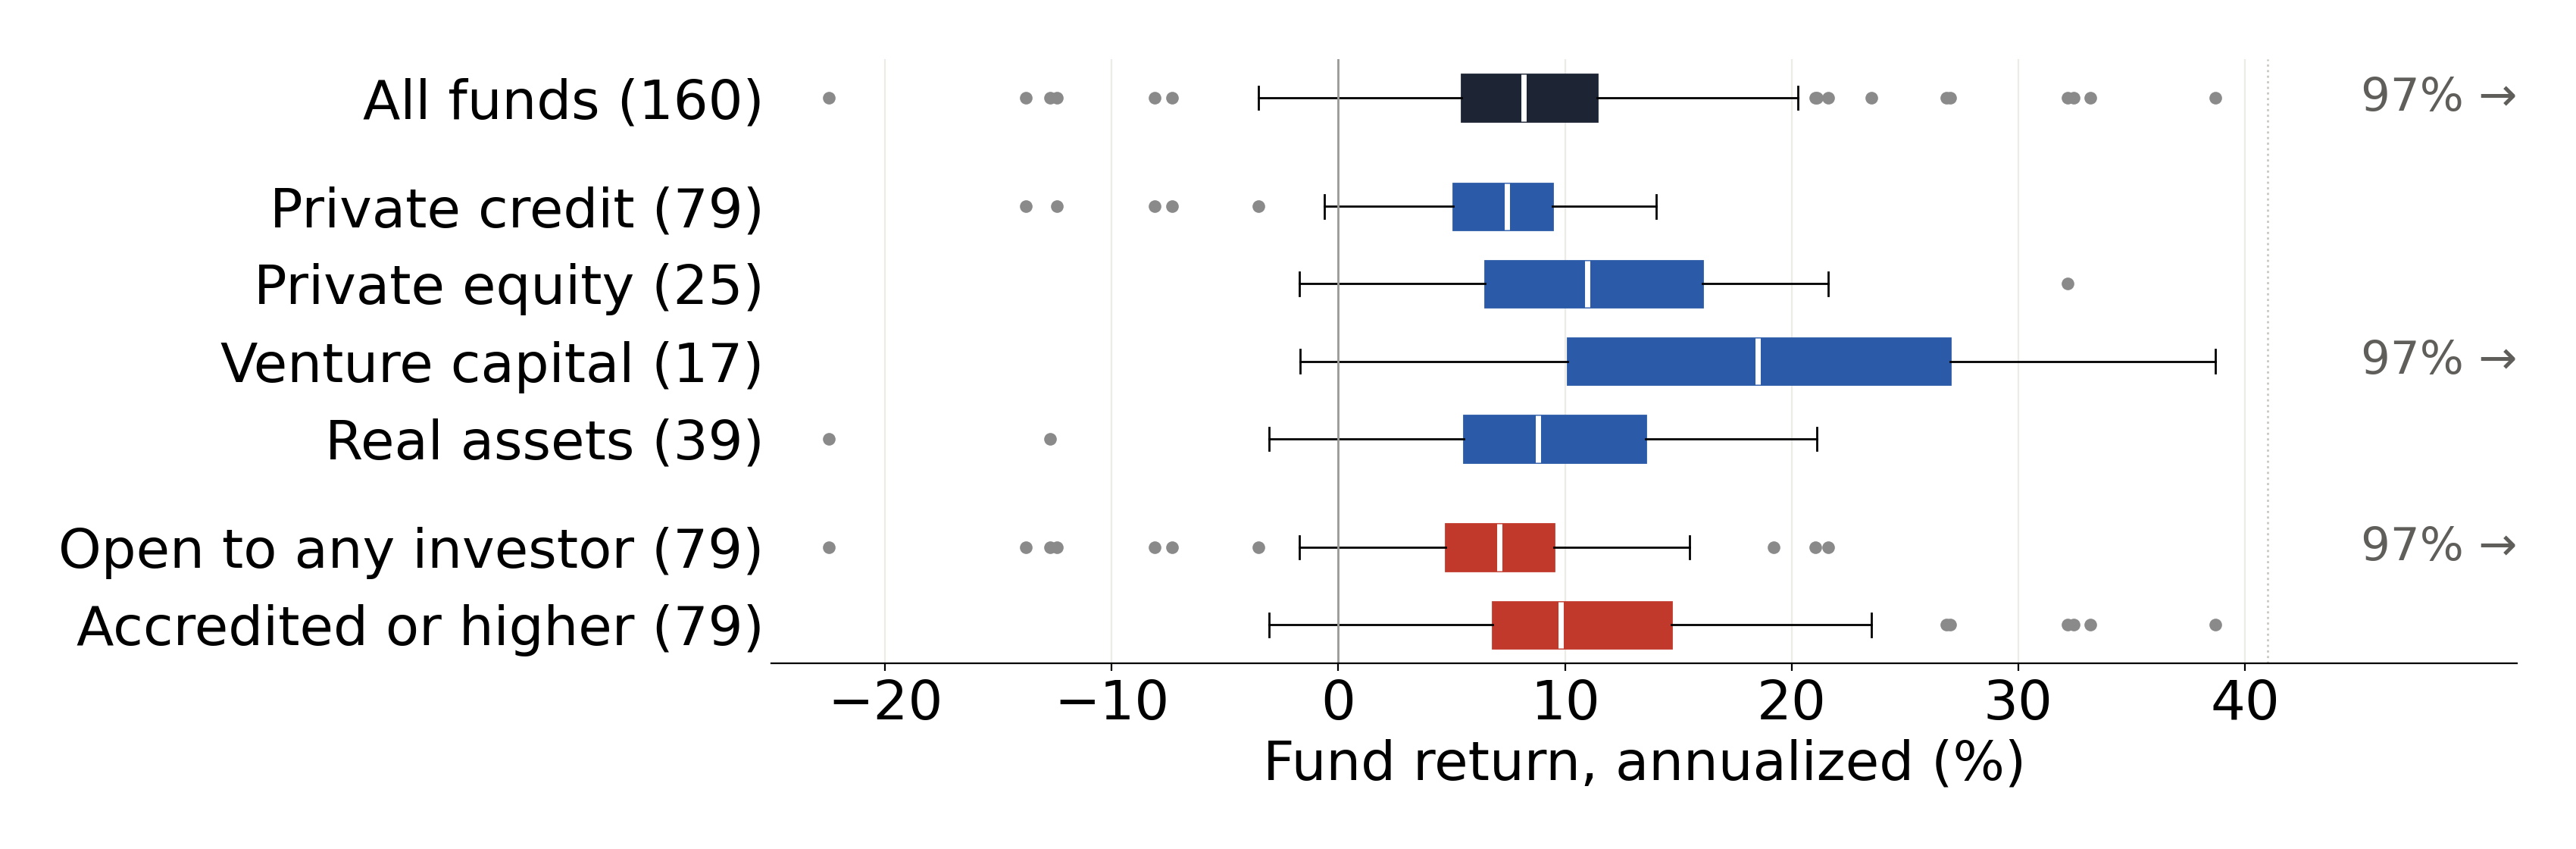
For institutional investors (LPs), the main job in private markets is manager selection
The wide dispersion in retail funds suggests this skill is needed
Fund return: annualized mean quarterly net return, 2019Q4-2026Q1, same fund-quarters as the main return regressions (net return and positive lagged NAV; no minimum quarters). Number of funds in parentheses. Boxes: median and interquartile range; whiskers 1.5 x IQR; dots are individual funds beyond the whiskers. Axis capped at 40%: one venture fund at 97% is marked at the right edge.
Columbia Business School
Ewens and Faber · NHH 2026
Does manager experience matter?
The fund sample
Decomposition
Two-sided liquidity
Incentives and governance
Retail is not institutional
Does manager experience matter?
Conclusion
Columbia Business School
Ewens and Faber · NHH 2026
Manager skill/experience
Experience and skill are a big driver of persistence and outperformance in traditional private equity and venture capital (Brown et al. 2025)
Deal flow matters more than value add (Sorensen 2008)
Individual managers matter and add value to portfolio companies (Ewens and Rhodes-Kropf 2012; Ewens and Sosyura 2025): not possible in these funds
If and how does that translate to these funds, which on average underperform?
Definition of experience
Had the fund or its adviser worked in private markets in any way before this industry launched in 2016?
Columbia Business School
Ewens and Faber · NHH 2026
Does the experience measure work?
Experienced minus inexperienced
Private credit
Private equity
Log fund NAV
1.23***
0.49
(0.33)
(0.67)
Fund age (years)
−2.4
4.8*
(2.5)
(2.6)
Log number of positions
0.96***
−0.24
(0.32)
(0.70)
Quarter FE
Yes
Yes
Funds
80
25
Standard errors clustered by fund in parentheses. * p<0.10, ** p<0.05, *** p<0.01
Each cell: coefficient on an experienced indicator, fund-quarter regression with quarter FE. Fund age = years since the fund was founded. Group means: PC Log fund NAV: experienced 19.92, inexperienced 18.71; PE Log fund NAV: experienced 19.88, inexperienced 19.28; PC Fund age (years): experienced 3.94, inexperienced 6.22; PE Fund age (years): experienced 8.40, inexperienced 3.66; PC Log number of positions: experienced 5.48, inexperienced 4.52; PE Log number of positions: experienced 4.20, inexperienced 4.37. Source: output/exp_characteristics/validation.csv
Columbia Business School
Ewens and Faber · NHH 2026
Do experienced managers earn higher returns?
Long-short: experienced minus inexperienced, on market and private index
Experienced minus inexperienced
Private credit
Private equity
Venture capital
Alpha difference (bp/qtr)
141***
101**
−2
(31)
(42)
(107)
Market beta difference
−0.036
0.078
0.359**
(0.029)
(0.051)
(0.158)
Private-index beta difference
−0.362**
−0.004
−0.382**
(0.160)
(0.116)
(0.151)
Mean spread (bp/qtr)
76
131
−11
Quarters
26
24
24
⇒ Alpha and lower private markets exposure for experienced funds
⇒ Both still trail the benchmark: PC −31 vs. −92, PE −57 vs. −134 bp/qtr
Quarterly return of the experienced-adviser portfolio minus the inexperienced-adviser portfolio (NAV-weighted, adjusted for each group's calibrated retail fee and cash share) regressed on the market excess return and the strategy MSCI index excess return. Robust (HC1) standard errors in parentheses; * p<0.10, ** p<0.05, *** p<0.01. Source: output/talk_experience_v2/longshort.json (longshort.tex).
Columbia Business School
Ewens and Faber · NHH 2026
Experienced funds look different
Private credit: experienced funds hold less cash and borrow more
PE: experienced funds hold more through pooled funds
No difference in fees, manager stakes, or how much of an inflow stays in cash
Experienced minus inexperienced
Private credit
Private equity
Open to any investor
−0.27**
−0.10
(0.13)
(0.13)
Cash share
−0.029*
−0.010
(0.015)
(0.042)
Leverage (borrowings / NAV)
0.06*
−0.01
(0.03)
(0.01)
Expense ratio (%)
0.81
−0.03
(0.53)
(0.43)
Fund interests share
−0.08
0.24*
(0.05)
(0.13)
Manager stake, any
0.06
−0.16
(0.14)
(0.23)
Cash kept per $1 of inflow
−0.09
−0.38
(0.21)
(0.23)
Quarter FE
Yes
Yes
Standard errors clustered by fund in parentheses. * p<0.10, ** p<0.05, *** p<0.01
Each cell: coefficient on an experienced indicator, fund-quarter regression with quarter FE (cash kept per $1 of inflow: experienced x inflow in the deployment regression). Group means (fund-quarters): PC Open to any investor: experienced 0.51, inexperienced 0.78; PE Open to any investor: experienced 0.05, inexperienced 0.14; PC Cash share: experienced 0.060, inexperienced 0.090; PE Cash share: experienced 0.128, inexperienced 0.139; PC Leverage (borrowings / NAV): experienced 0.13, inexperienced 0.07; PE Leverage (borrowings / NAV): experienced 0.01, inexperienced 0.02; PC Expense ratio (%): experienced 3.33, inexperienced 2.55; PE Expense ratio (%): experienced 2.12, inexperienced 2.17; PC Fund interests share: experienced 0.06, inexperienced 0.14; PE Fund interests share: experienced 0.85, inexperienced 0.62; PC Manager stake, any: experienced 0.62, inexperienced 0.56; PE Manager stake, any: experienced 0.61, inexperienced 0.76; PC Cash kept per $1 of inflow: experienced 0.29, inexperienced 0.39; PE Cash kept per $1 of inflow: experienced 0.40, inexperienced 0.79
Columbia Business School
Ewens and Faber · NHH 2026
Private credit: direct-lending platforms
Where does the private credit premium come from?
Experienced funds hold many more loans: 908 vs. 156 positions; 60% vs. 39% Level 3
They earn more income: 1.78% vs. 1.22% of NAV per quarter
And borrow more: 13% vs. 5% of NAV
Same loan, same quarter: experienced funds mark it 1.1% lower (not significant)
No sign of riskier loans: coupon 8.7% vs. 9.3%, defaults 0.6% in both (no significant difference)
⇒ Income from direct loans, not higher marks
Columbia Business School
Ewens and Faber · NHH 2026
PE: unrealized gains
Where does the PE premium come from?
Experienced funds hold more through pooled funds: 78% vs. 57%
Higher returns, mostly unrealized gains: 3.79% vs. 1.27% of NAV per quarter
Same underlying fund, same quarter: experienced holders value it 0.56% lower (not significant)
Not secondaries bought at a discount: 18% of private assets in both groups
⇒ Consistent with experienced managers picking underlying funds that gain more value, not higher marks (gains not yet realized)
Columbia Business School
Ewens and Faber · NHH 2026
Conclusion
The fund sample
Decomposition
Two-sided liquidity
Incentives and governance
Retail is not institutional
Does manager experience matter?
Conclusion
Columbia Business School
Ewens and Faber · NHH 2026
What this teaches us about retirement
What retirement products with alternatives will look like
Daily valuations
Entry and exit (liquidity) daily
Mostly fund-of-funds models
What our results imply
Retirement plan participants likely don't behave like the retail investor in our sample
Defaulted into plans; savers
Manager selection now falls on the target-date fund creators or 401(k) sponsors, acting as the LP
Fees: scale will be in their favor
Previous version (results-based bullets): Daily pricing: NAVs are manager marks that adjust slowly to markets; Liquidity provision: cheap so far (about 7% of NAV in cash), but untested in a downturn; Deploying inflows: most of a new dollar reaches private assets within the quarter; Investor behavior: retail investors are not the driver of the gap; Manager selection is the skill that matters, and experienced access may not scale to trillions in retirement money; Fees: the largest piece; scale and bargaining power should shrink it. Candidate for "what else" (Claude, not ME): Inflows arrive with every paycheck: steady, predictable contributions.
Columbia Business School
Ewens and Faber · NHH 2026
Back to the gap: where the stressors show up
Fees
47%
Cash drag
17%
Private exposure
36%
Fees: the largest piece, raised by retail and liquidity; scale should shrink it
Cash drag: modest (about 7% of NAV); untested in a downturn
Private exposure (mainly PE and VC): some tilt toward faster-distributing assets
Not measurement (smoothing), not worse funds (selection)
Weak evidence that incentives and governance matter
Manager skill matters: experienced private credit funds' gap −31 vs. −92 bp/qtr
Retail investors chase performance less and do not run
Columbia Business School
Ewens and Faber · NHH 2026
Backup
Columbia Business School
Ewens and Faber · NHH 2026
Board structure and independence
In drawdown funds, limited partners have limited control over the fund. These vehicles are different: a board, with independent members, oversees the fund
Boards are small
Structured for the regulatory min (4 members, with 3 independents)?
25% of trustees sit on multiple boards of the same advisor
Continuous subscriptions and available liquidity create:
Deployment lag
Redemption demand creates the sleeve tilt toward liquidity
Transacting at NAV forces the model to mark, potential transfer
Moves the portfolio away from the institutional benchmark.
When investors actually ask to leave, does the promise hold?
Columbia Business School
Ewens and Faber · NHH 2026
What are these funds?
Typical registration language
“is a recently formed Delaware limited liability company registered under the Investment Company Act of 1940, as amended (the “1940 Act”), as a closed-end, non-diversified, management investment company.”
Some unregistered vehicles (e.g., BXPE).
Two major (registered choices) often labeled “semi-liquids”:
Demand overruns are real but small enough to be met from sleeves and credit lines
The liquidity promise has held so far because it has barely been tested
Retail has not proven flightier than institutional money
Inflows have kept pace with redemptions
Columbia Business School
Ewens and Faber · NHH 2026
Experience and fund size
Split at each strategy's median net assets ($0.26bn credit, $0.77bn equity)
Experience
Size
Funds
NAV ($bn)
β_D (s.e.)
Cash w_c (%)
Fee (%)
Gap (bp/qtr)
PC
Experienced
Large
21
63.0
1.011 (0.242)
3.7
3.32
−25
PC
Inexperienced
Small
27
2.9
1.023 (0.094)
7.2
2.66
−73
PC
Inexperienced
Large
19
9.4
1.426 (0.127)
6.6
2.73
−103
PC
Experienced
Small
13
1.5
0.912 (0.220)
6.2
4.04
−158
PE
Experienced
Large
8
26.4
0.553 (0.125)
12.8
2.98
8
PE
Inexperienced
Large
4
5.7
0.495 (0.063)
8.8
1.76
−132
PE
Inexperienced
Small
6
1.9
0.793 (0.168)
12.8
2.45
−142
PE
Experienced
Small
7
2.4
0.908 (0.117)
11.9
2.83
−184
Columbia Business School
Ewens and Faber · NHH 2026
Experienced and inexperienced portfolios
Funds
NAV ($bn)
Mean return (%/qtr)
Corr. with benchmark
Private credit, experienced
34
64.4
1.83
0.92
Private credit, inexperienced
46
12.3
1.22
0.96
PE, experienced
15
28.8
2.76
0.82
PE, inexperienced
10
7.5
2.52
0.82
Columbia Business School
Ewens and Faber · NHH 2026
Decomposing the gap by experience
A. Gap components (bp/qtr)
Gross premium
Retail fees
Cash drag
Public markets
Beta shortfall
Gap
Private credit, experienced
11
−83
−6
36
11
−31
Private credit, inexperienced
−120
−68
−10
46
60
−92
PE, experienced
128
−74
−34
12
−89
−57
PE, inexperienced
110
−47
−31
−35
−132
−134
B. Long-short: experienced minus inexperienced, fee- and cash-adjusted, on market and MSCI index
Alpha difference (bp/qtr)
s.e.
Quarters
Funds (exp./inexp.)
Private credit
+141
31
26 (2019Q4–2026Q1)
34 / 46
PE
+101
42
24 (2020Q2–2026Q1)
15 / 10
Columbia Business School
Ewens and Faber · NHH 2026
Private credit: direct-lending platforms
A. Holdings (fund averages, 34 / 46 funds)
Share of the long portfolio
Experienced
Inexperienced
p
Level 3
0.60
0.39
0.004
Level 1
0.08
0.14
0.03
Fund interests
0.03
0.13
0.01
Number of positions
908
156
0.07
Top-10 positions' share
0.42
0.52
0.07
B. Return sources (34 / 45 funds)
% of NAV per quarter
Experienced
Inexperienced
p
Income and other
1.78
1.22
0.07
Realized gains
−0.07
−0.13
0.63
Unrealized gains
−0.20
0.19
0.08
Borrowings (% of NAV)
13.4
4.9
0.015
Same loan, same quarter: experienced funds mark Level 3 debt 1.14% lower (s.e. 0.96)
Columbia Business School
Ewens and Faber · NHH 2026
PE: unrealized gains
A. Holdings (fund averages, 15 / 10 funds)
Share of the long portfolio
Experienced
Inexperienced
p
Held through pooled funds
0.78
0.57
0.07
Short-term investment vehicles
0.15
0.08
0.09
Level 3
0.22
0.28
0.56
Number of positions
121
102
0.52
B. Return sources
% of NAV per quarter
Experienced
Inexperienced
p
Total return
3.21
1.92
0.04
Unrealized gains
3.79
1.27
0.01
Income and other
−1.34
−0.05
0.02
Realized gains
0.81
0.53
0.43
Same underlying fund, same quarter: experienced holders revalue it −0.56% per quarter (s.e. 0.78)
Columbia Business School
Ewens and Faber · NHH 2026
Are retail-facing vehicles less experienced?
Private credit: 35% of funds open to any investor are experienced, vs. 58% of accredited-only funds
Share of funds that are experienced
Private credit
PE
All
Open to any investor
35%
60%
37%
Funds
55
5
60
Accredited or higher
58%
60%
59%
Funds
24
20
44
Difference (pp)
−24*
0
−19*
(12)
(26)
(11)
One observation per fund. Difference: OLS of experienced on open to any investor (All: adds a strategy indicator); robust standard errors in parentheses. * p<0.10, ** p<0.05, *** p<0.01
paper/build/talk_exp_by_access.py -> output/exp_characteristics/exp_by_access.csv. Funds of the experience long-short sample; access from the master list investorQualification.
Columbia Business School
Ewens and Faber · NHH 2026
A preview: retirement solutions
[Screenshot: Wellington / KKR retirement vehicle, to add]
Retirement offerings of private markets have to solve
Daily pricing
Liquidity provision
Deploying capital when capital flows in
Investor behavior of individuals
Assumption throughout: retail investors behave differently from institutions and lack the information infrastructure to solve information asymmetry problems
Previous outline: Why is this even a convo (Example Wellington / Apollo? To show that the path into retirement); Retirement will have to solve: Daily pricing, Liquidity provision, Deployment, Different investor from institutions; Retail demands more liquidity, lacks information and infrastructure; The discussion is not about putting retail next to institutions
Columbia Business School
Ewens and Faber · NHH 2026
Alternative investing since the 1980s
The drawdown fund
Limited-life fund, raised every 3–5 years
Active ownership by general partners of funds and portfolio companies
Typical hold periods of 4–10 years
Liquidity driven mainly by GP choice; limited secondary markets
No prices: valuation set by a combination of GP and audits
Skin in the game for incentives
Profit sharing and fees based on book value, not marked
Main investors: institutions such as pension funds and endowments
How to invest: manager selection, patience, and substitutes for typical output provided by public assets
Previous outline text: Mostly drawdown (Stats on recent phenomenon); Active ownership; Long hold in private assets; Yes, evergreens, but limited; Liquidity; Valuation; Incentives; Who: Institutional investors; How: manager selection, patience, and substitutes for typical output provided by public assets
Columbia Business School
Ewens and Faber · NHH 2026
The registered retail private markets fund
Interval and tender offer funds
Evergreen: raises money daily to monthly
Mainly passive ownership: fund-of-funds, co-investment, or access to adviser deals
Hold periods similar to drawdowns: 4–10 years
Exit liquidity driven partly by investors: at minimum a quarterly choice, with gating
Prices: daily NAVs marked by GPs; investors trade at them
No skin-in-the-game requirement (most have some; ~1.5% of NAV)
Profit sharing limited to a subset of fund structures; fees based on manager-marked NAV
Who may invest: anyone, in about half of funds
How to invest: brokers, financial advisors, retirement channels, etc.
Preview of the interval and tender offer structure: as we will see, not just the ~160 funds, but a model that will likely be used in retirement.
Columbia Business School
Ewens and Faber · NHH 2026
What should we expect?
How do these vehicles perform?
They start at a disadvantage, but they could be a wrapper with a layer of fees
Then they deliver the exposure and the risk-adjusted return, less the fee
That requires deal flow and some form of indexing
If there is a gap, what is it?
Fees
Cash drag
The challenge of replicating representative private-market exposure
Taking on retail investors with known characteristics
Previous outline (Why invest in alts?): The literature review slide about the benefits (best case in the perspective of this paper); Diversification (not clear!) and returns enhancement (depends)
Columbia Business School
Ewens and Faber · NHH 2026
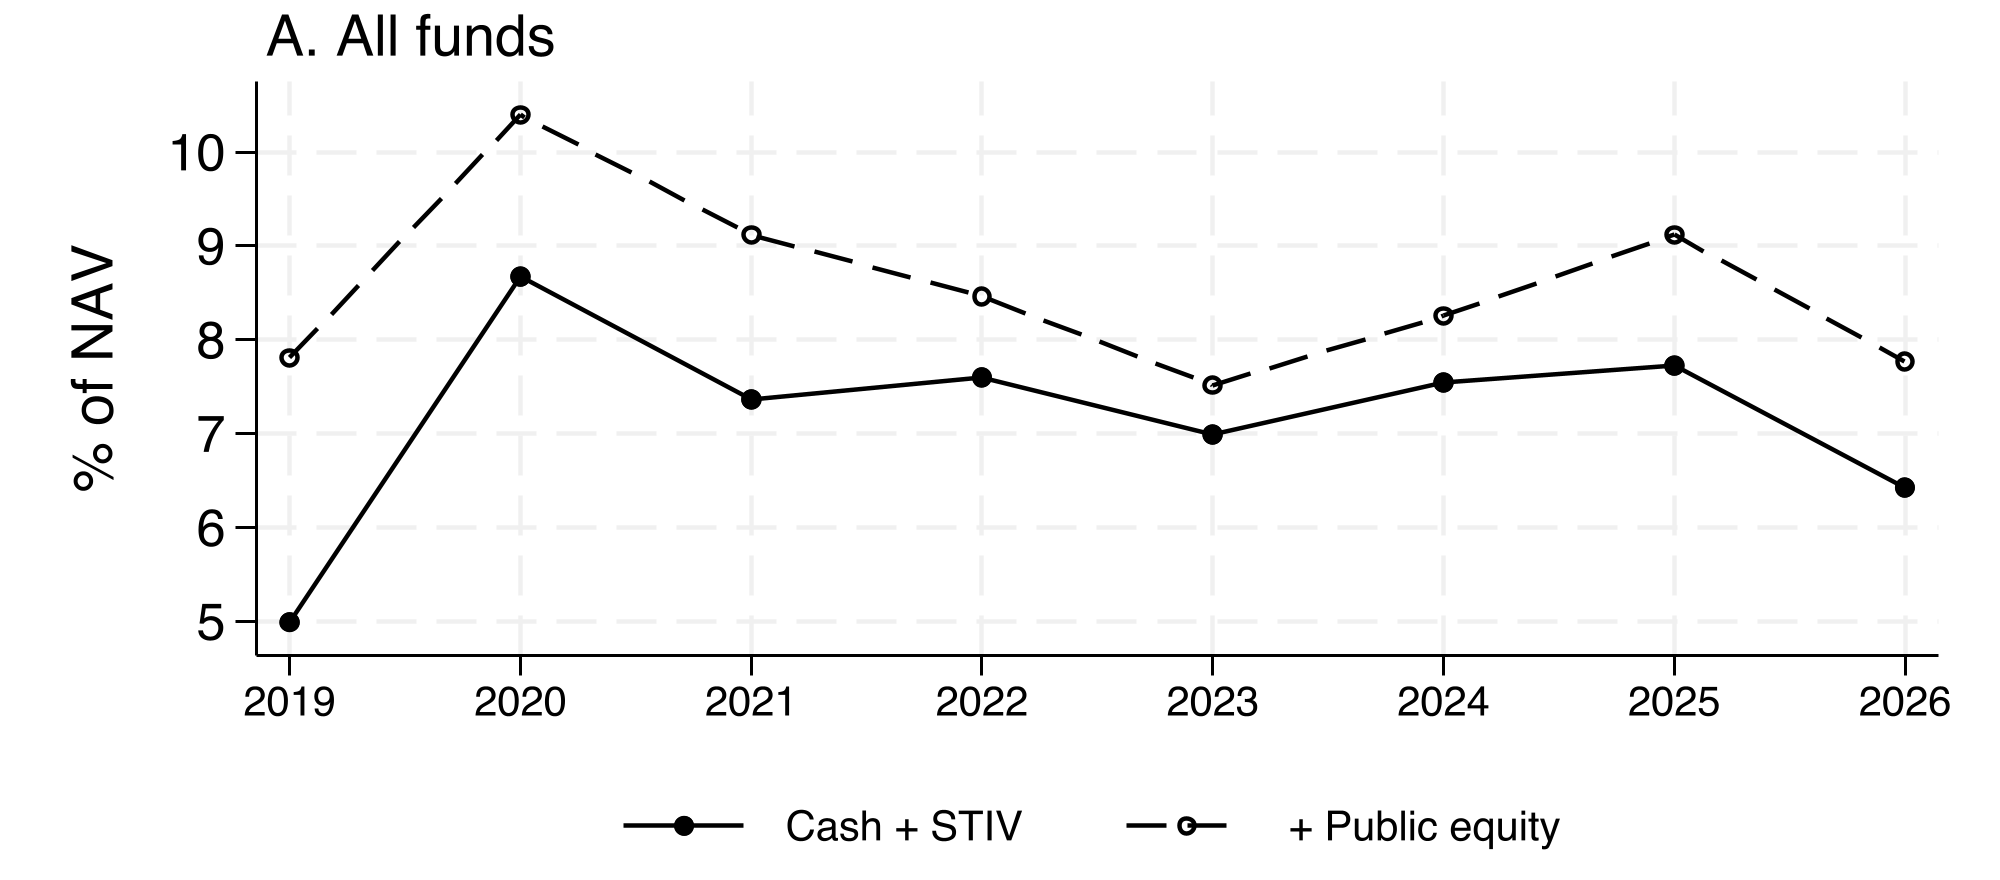
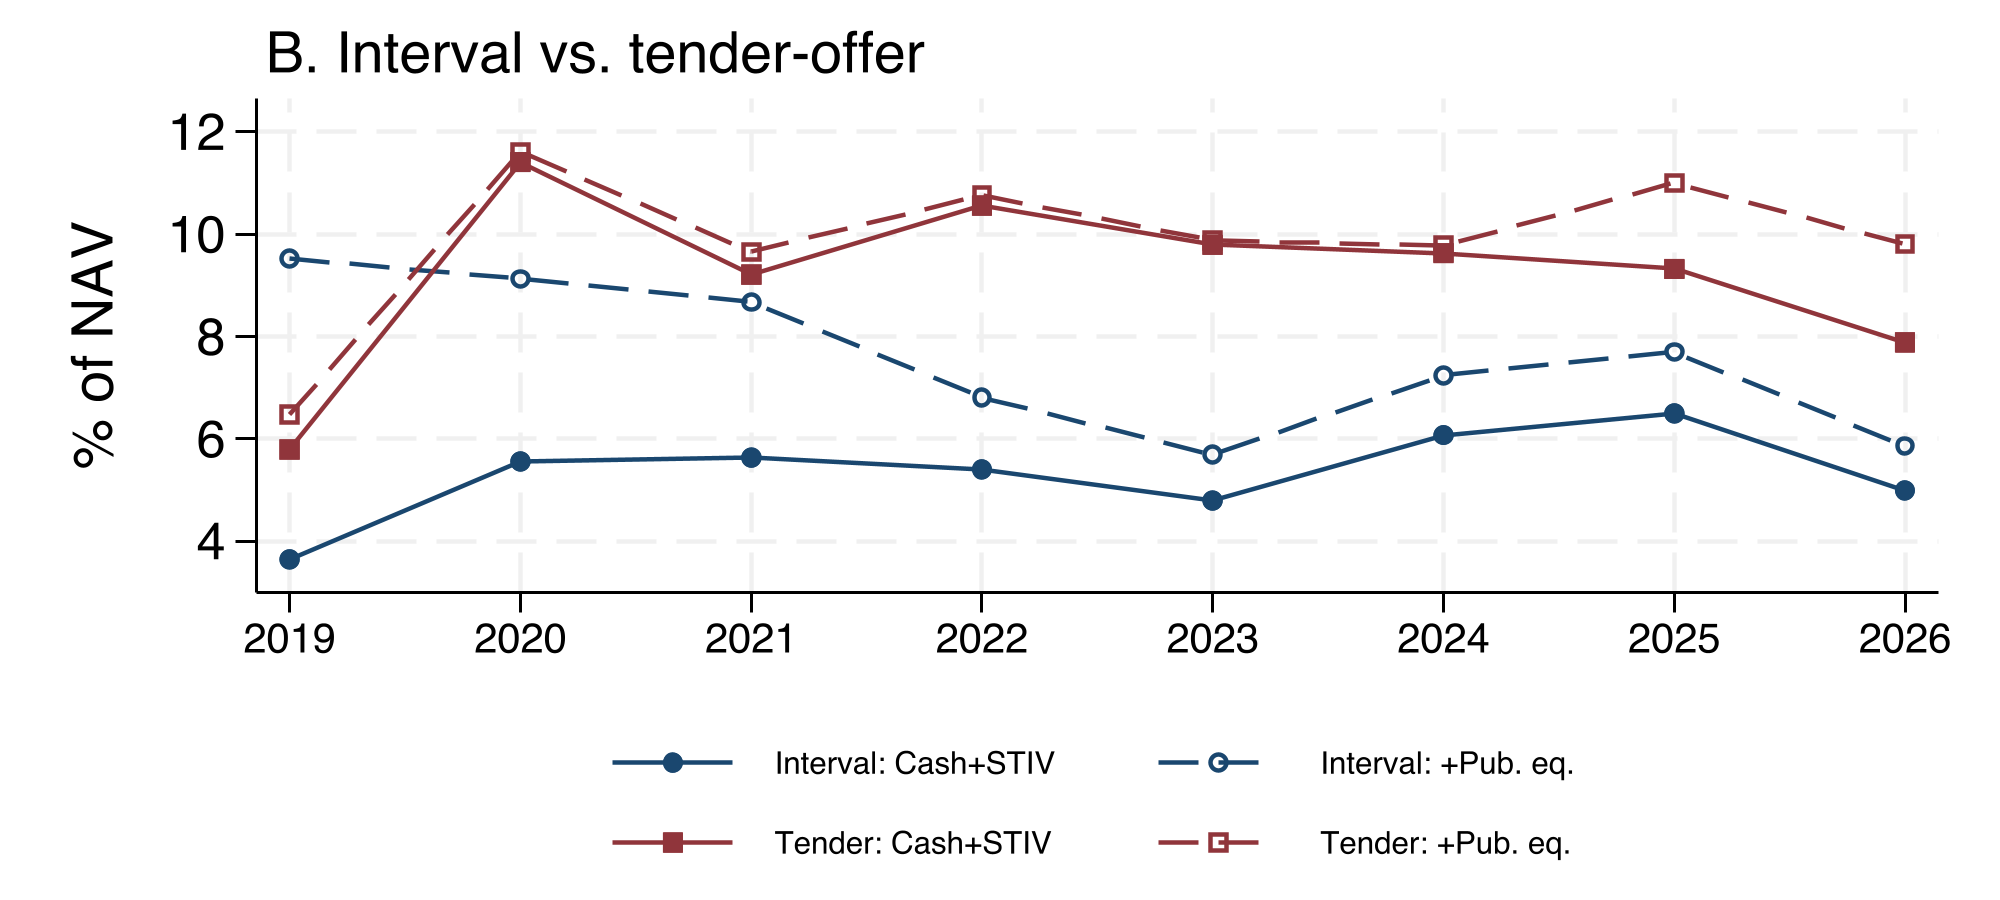
The liquidity sleeve
Average: 6.6% of NAV in cash and short-term vehicles, 7.5% with public equity
Larger and older funds hold less
Tender offer funds do not have to provide liquidity, but many do, and they are much more likely to hold funds that require committed capital
NAV-weighted over fund-quarters; liquidity_sleeve_panel.csv, active funds, through the sample end, winsorized 2.5/97.5. Median across funds of each fund's average share: 11% and 12%. Regression (tab:liquid_determinants): log NAV and fund age negative and significant; no difference by structure or by open-to-any-investor access.
Columbia Business School
Ewens and Faber · NHH 2026
Where do interval and TO have advantages?
Deployment and compounding
Responsiveness to performance vs. lagged fundraising (different, potentially perverse incentives)
Columbia Business School
Ewens and Faber · NHH 2026
Suppose we have a $100 net inflow
After an inflow, private credit funds reach 94% of their target private allocation in the quarter, and 97% two quarters later
Columbia Business School
Ewens and Faber · NHH 2026
Response to a $100 inflow: other strategies (full figure)