EDIT MODE · click text to change it · press E to exit
Corporate Hierarchy
Michael Ewens and Xavier GiroudColumbia Business School & NBERSeptember 2026
Columbia Business School
Corporate Hierarchy
Motivation
Motivation
Theory
Measurement
Data and representativeness
Validation
Outcomes
What explains layers
Conclusion
Columbia Business School
Corporate Hierarchy

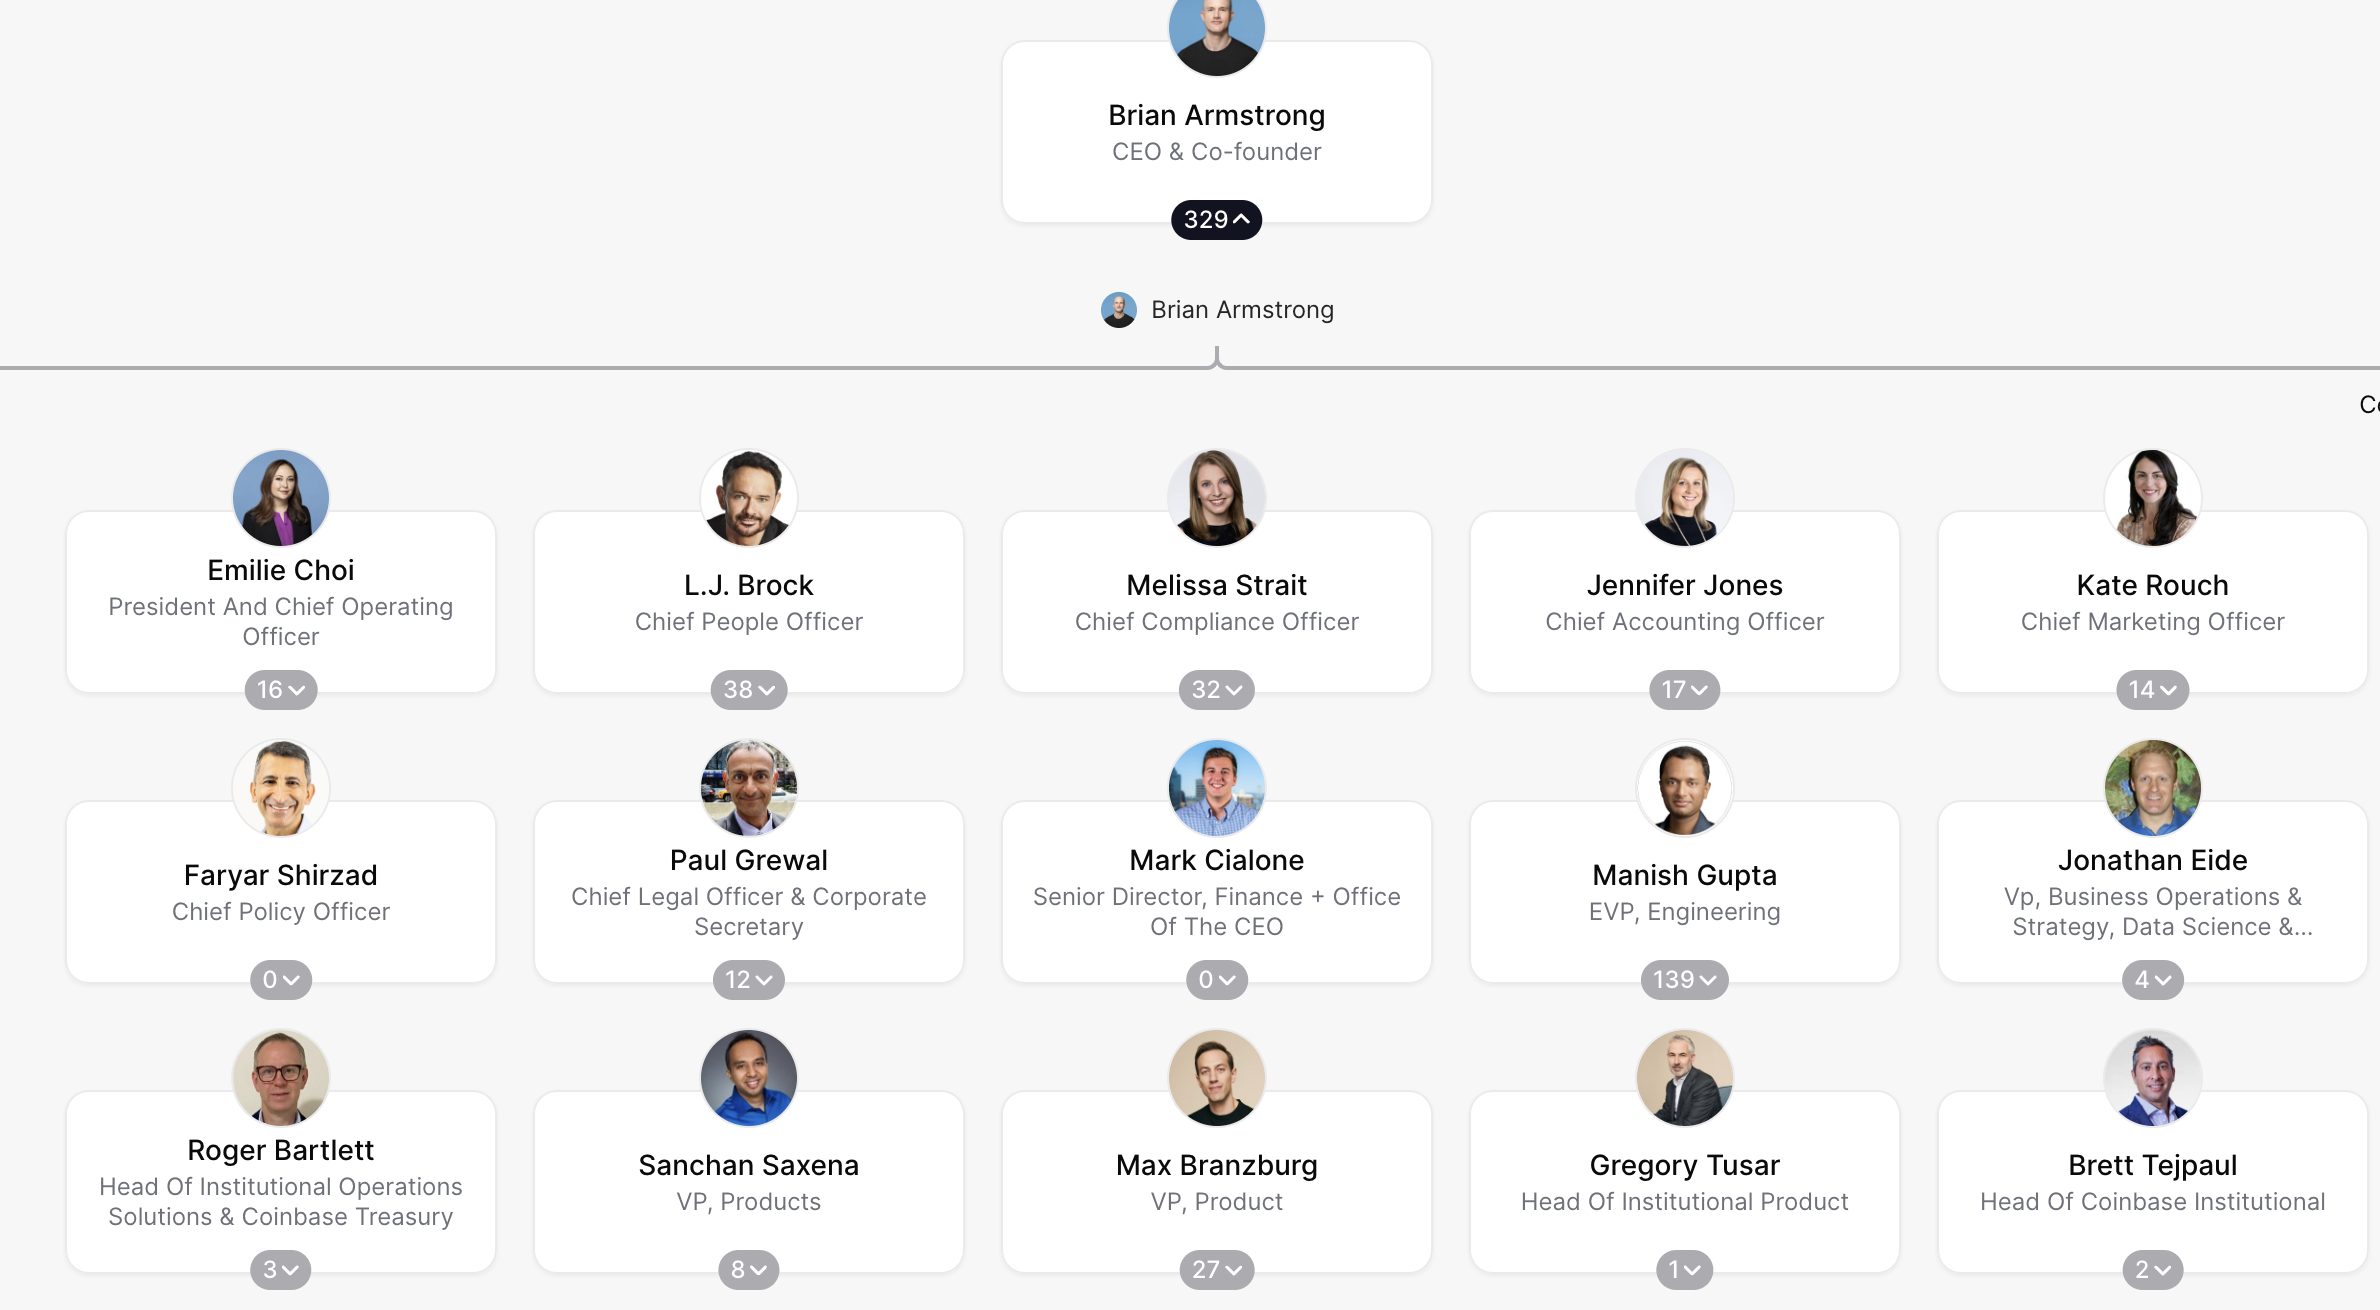
Public firms are complicated


Columbia Business School
Corporate Hierarchy

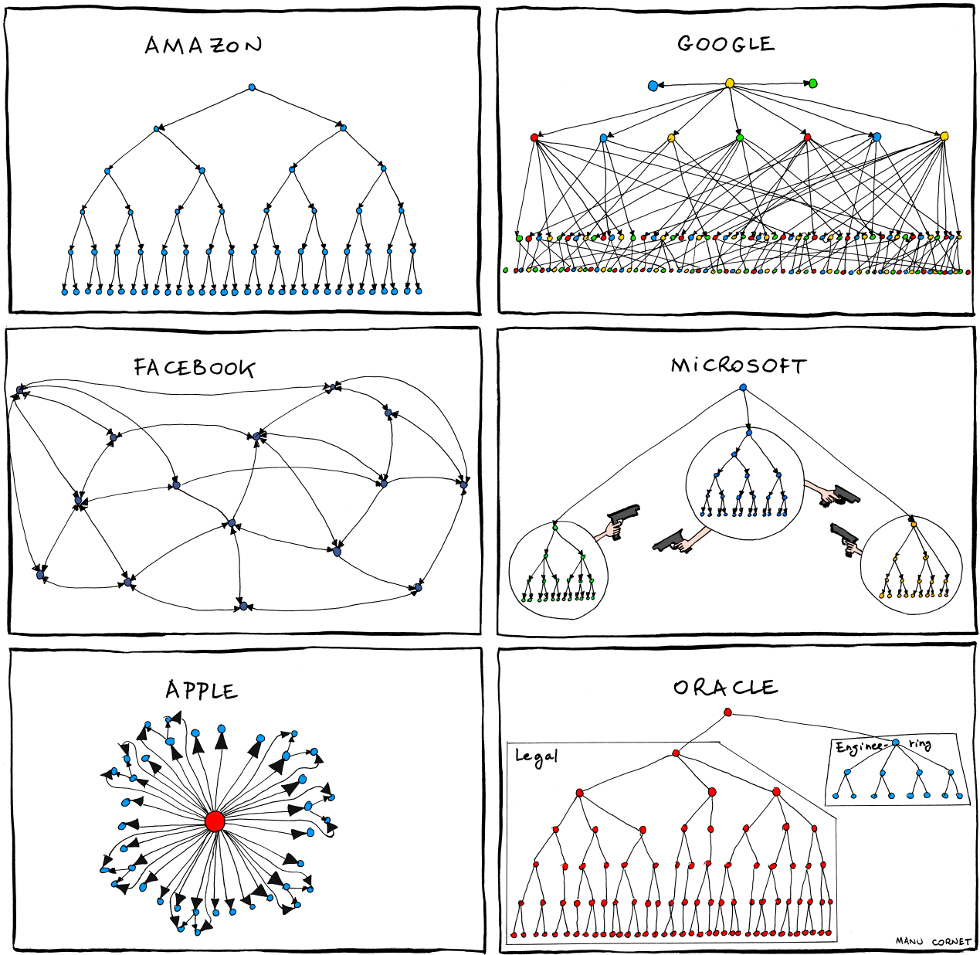
…and they differ
Columbia Business School
Corporate Hierarchy

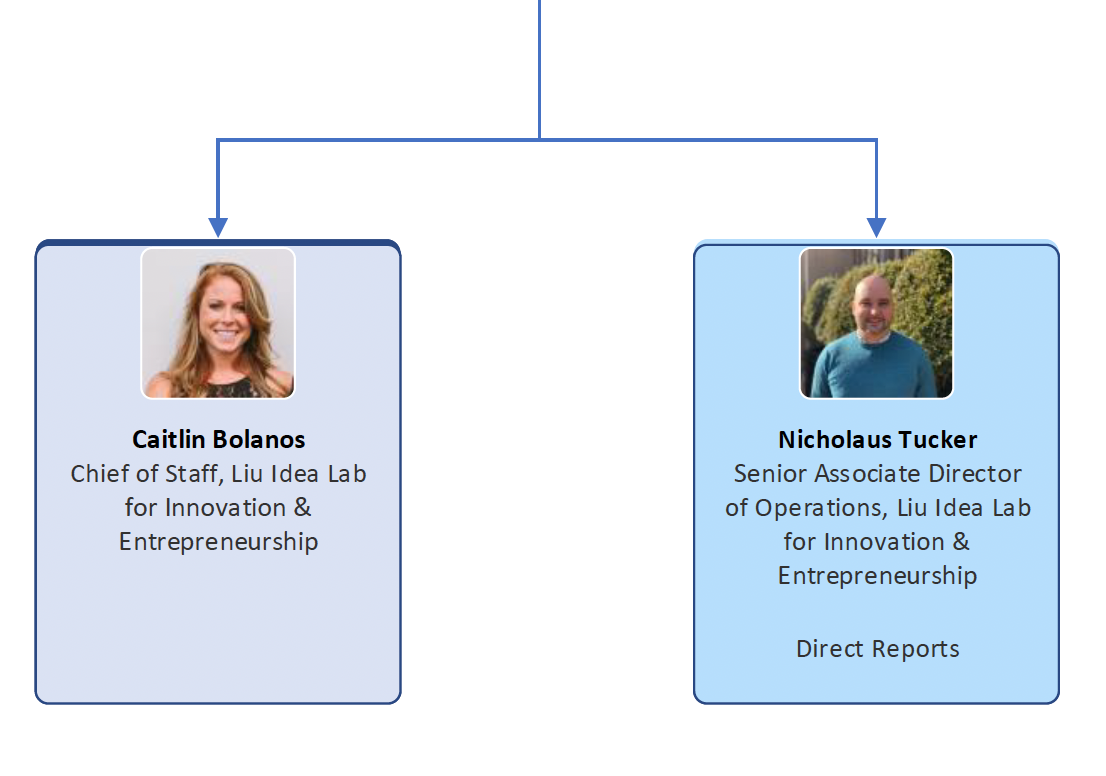
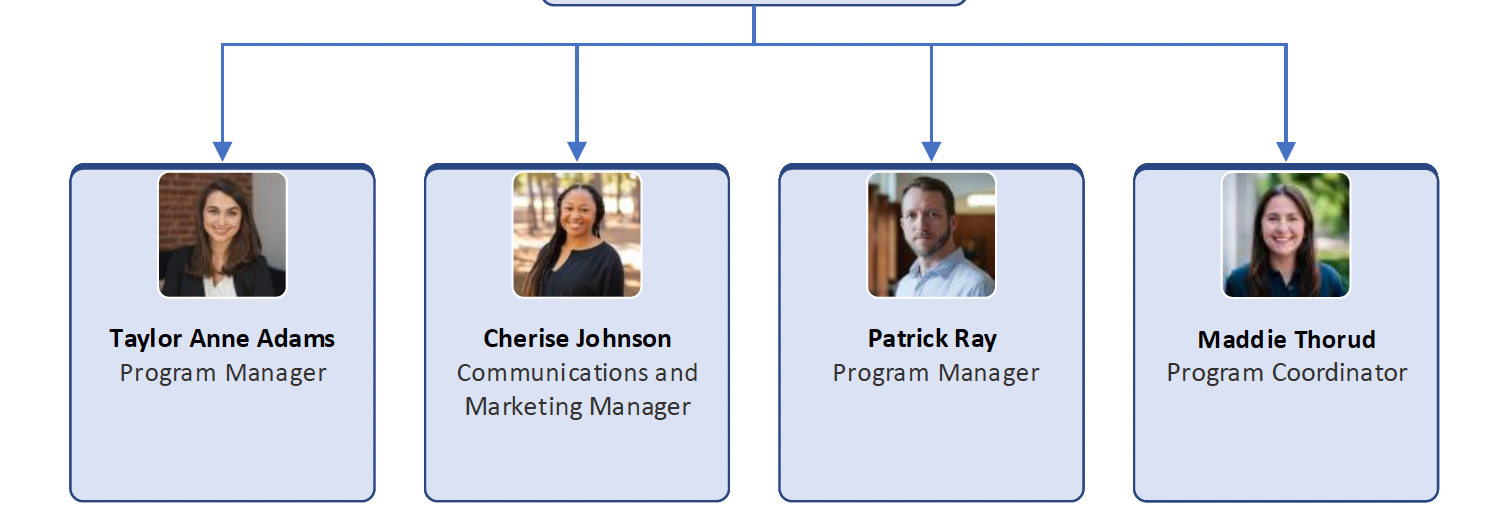
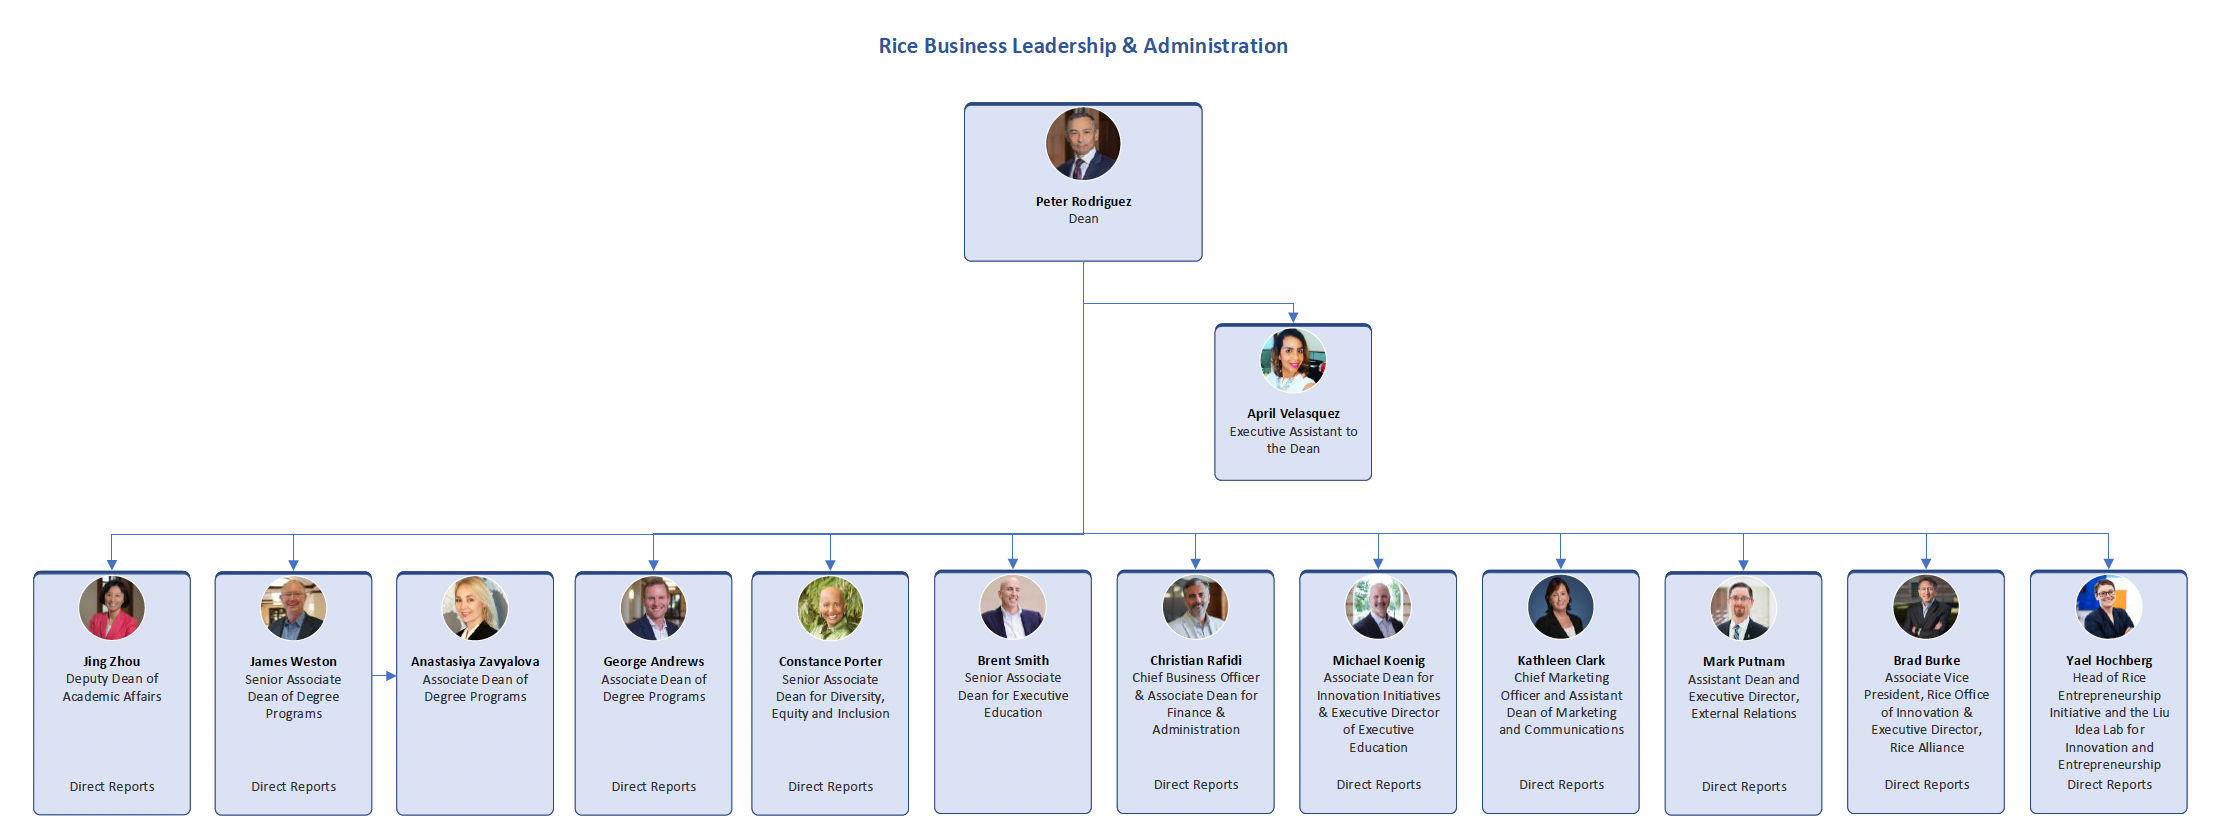
So are business schools
Columbia Business School
Corporate Hierarchy

The public firm hierarchy

  • Rarely find org. chart in 10-Ks
    • Voluntary disclosure → valuable proprietary information?
  • Few studies of public firms: unique regulatory and financial challenges to interact with hierarchy
  • Empirical literature focuses on the costs of public ownership
Columbia Business School
Corporate Hierarchy

Current approaches to measurement

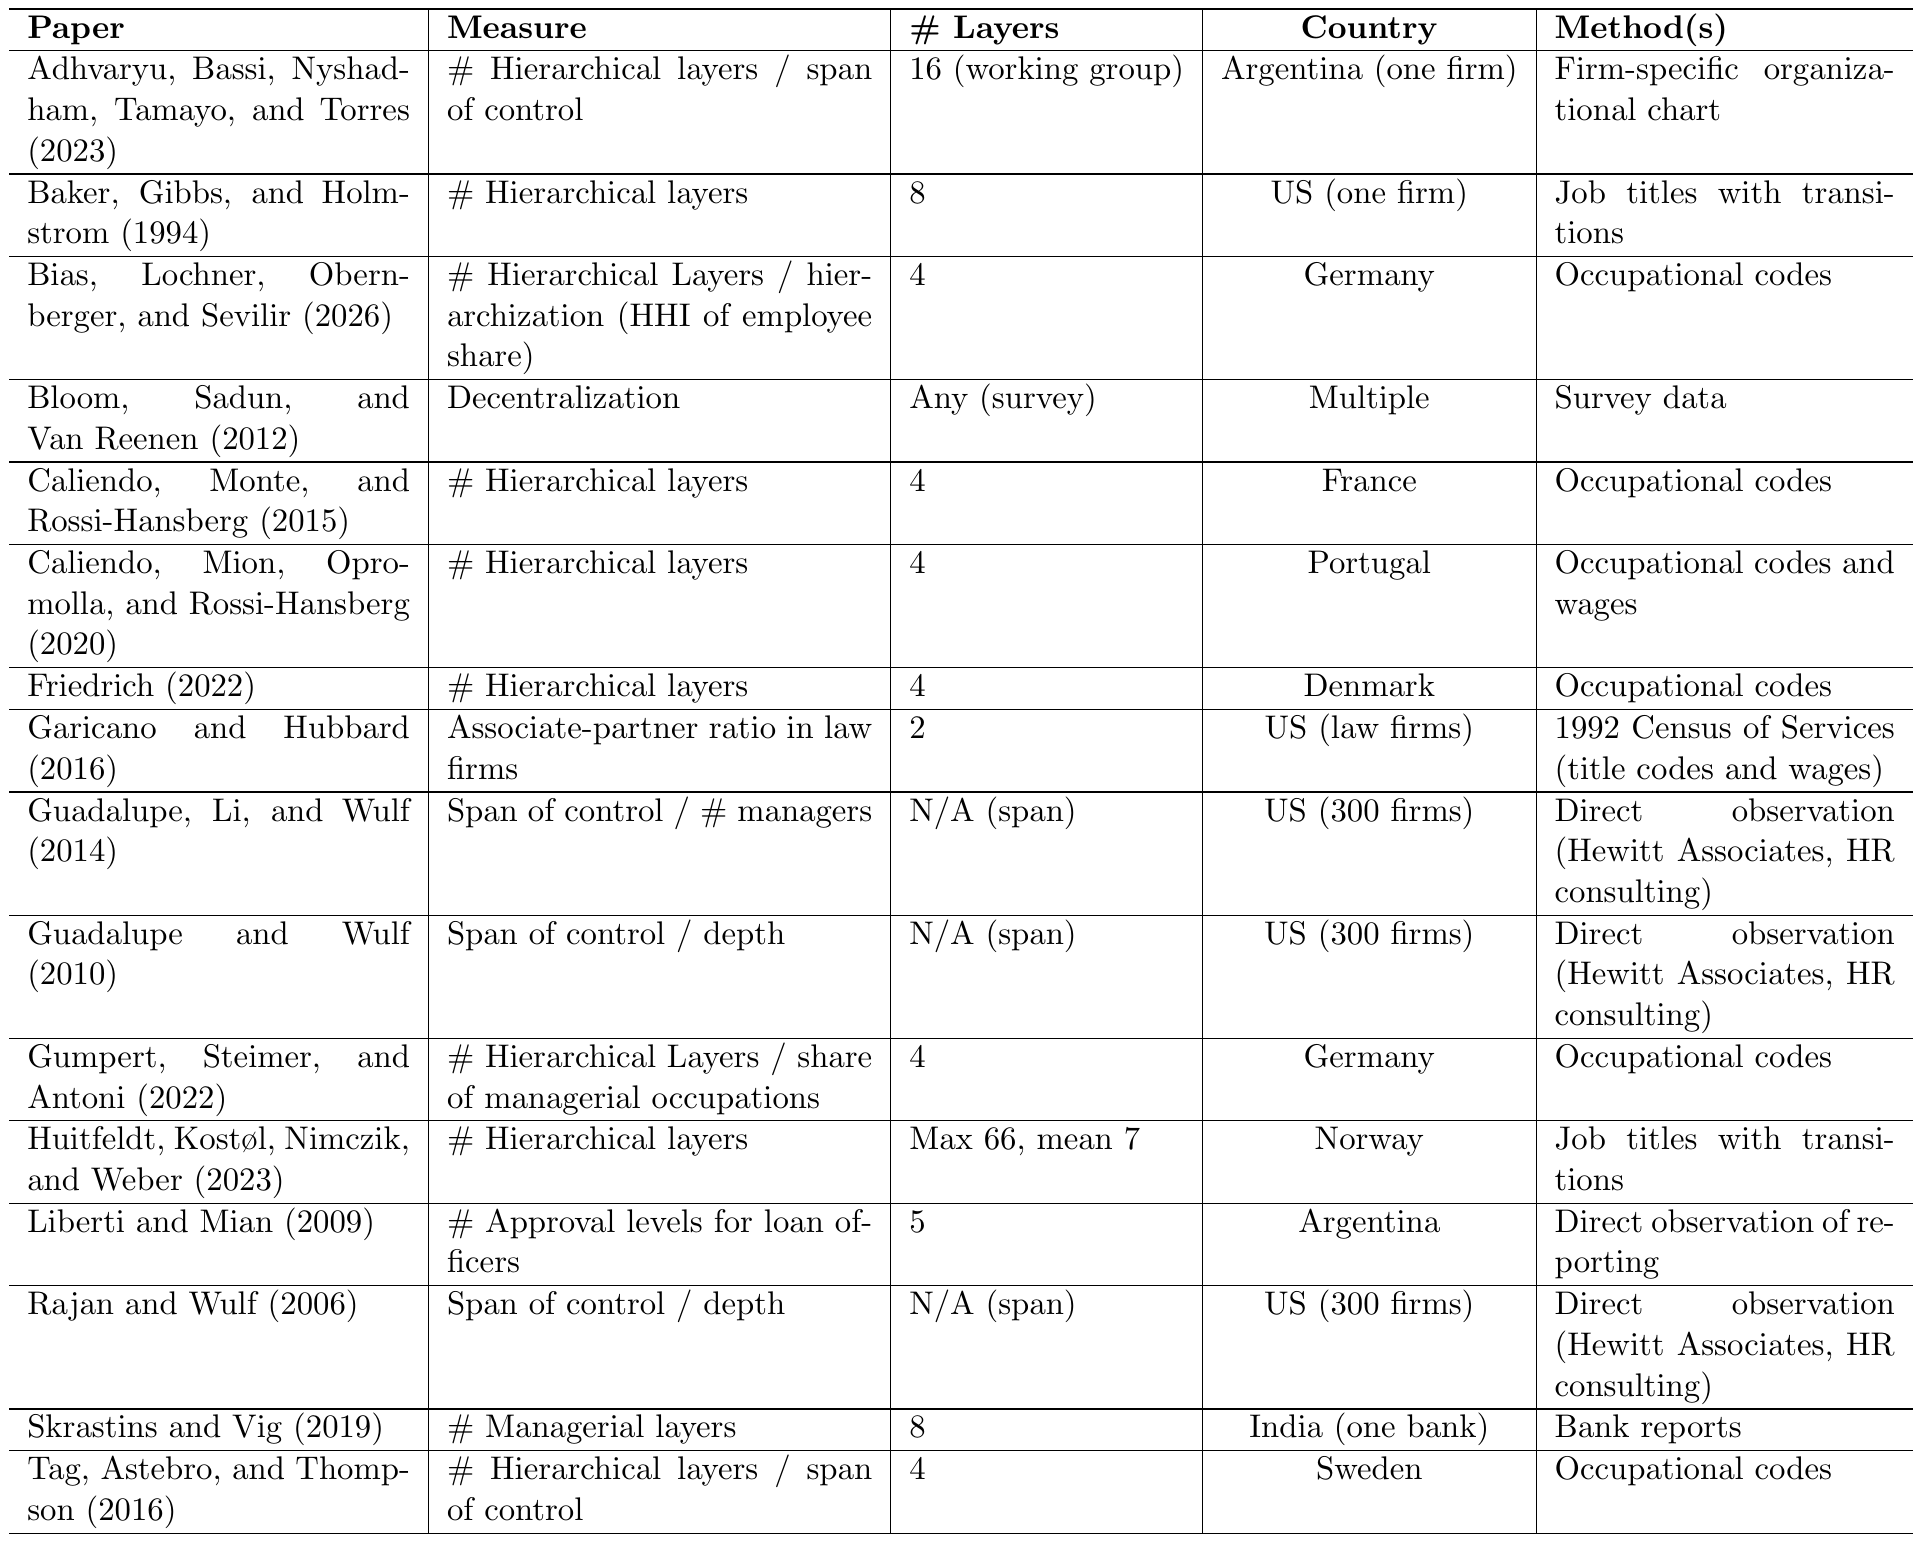
  • Constrained number of layers (4 to 8 in most papers); no metric for U.S. firms
  • # of CEO reports: view of the top, <1% of employees; data pre-2000
  • Homogeneous structures imposed across firms; titles mapped to one occupational code system
Columbia Business School
Corporate Hierarchy

Research questions

What are the determinants and implications of different organizational structures?

  1. How do we measure public firm corporate hierarchies?
  2. What do the hierarchies look like?
  3. Guided by theoretical frameworks, how does corporate hierarchy relate to firm decision-making and outcomes?
Columbia Business School
Corporate Hierarchy

Hierarchies: measurable and important

  • Resumes of 18.1 million workers at 3,454 US public firms
  • Firm-specific algorithm estimates the number of hierarchical layers
  • Average firm has 6.4 layers (median 6), pyramidal shape
  • More layers: longer tenure, more internal promotion, higher operating performance, lower volatility
  • AI adoption predicts flattening within firm
Columbia Business School
Corporate Hierarchy
Theory
Motivation
Theory
Measurement
Data and representativeness
Validation
Outcomes
What explains layers
Conclusion
Columbia Business School
Corporate Hierarchy

What is hierarchy?

“[D]etermine how much each employee knows, how many employees to hire, and how many layers of management to use in production” -Caliendo et al. (2020)

Exist to “solve coordination problems in the presence of specialization” - Garicano (2000)

Columbia Business School
Corporate Hierarchy

What is a layer?

“a group of employees, with similar characteristics summarized in their knowledge, who perform similar tasks within the organization. Conceptually, these layers are hierarchical in the sense that higher layers of management are smaller and include more knowledgeable employees who have as subordinates employees in lower layers.”
– Caliendo et al., 2015

Our challenge: “Dividing the employees in real firms into layers requires some mapping between these concepts and the data.”

Columbia Business School
Corporate Hierarchy

Three classes of models

  • Knowledge hierarchy: managers as problem solvers handling exceptions from below; layers add specialists (Garicano 2000; Garicano and Rossi-Hansberg 2006; Caliendo et al. 2015)
  • Information hierarchy: CEO’s span limited by information processing → delegation via layers (Radner 1993; Bolton and Dewatripont 1994; Stein 2002)
  • Incentive hierarchy: promotions provide incentives; layers create the career path; tournaments (Williamson 1967; Lazear and Rosen 1981; Malcomson 1984)
  • The tradeoff: gains from specialization vs. costs of communication + fixed cost of training managers
Columbia Business School
Corporate Hierarchy

Testing theory? …no.

Other than knowledge hierarchy, the direct empirical content of these theories is limited

We focus on

  • (i) documenting facts
  • (ii) correlating with outcomes of interest in corporate finance
  • (iii) let the set of frameworks help us interpret.
Columbia Business School
Corporate Hierarchy
Measurement
Using internal labor markets to reveal organizational form
Motivation
Theory
Measurement
Data and representativeness
Validation
Outcomes
What explains layers
Conclusion
Columbia Business School
Corporate Hierarchy

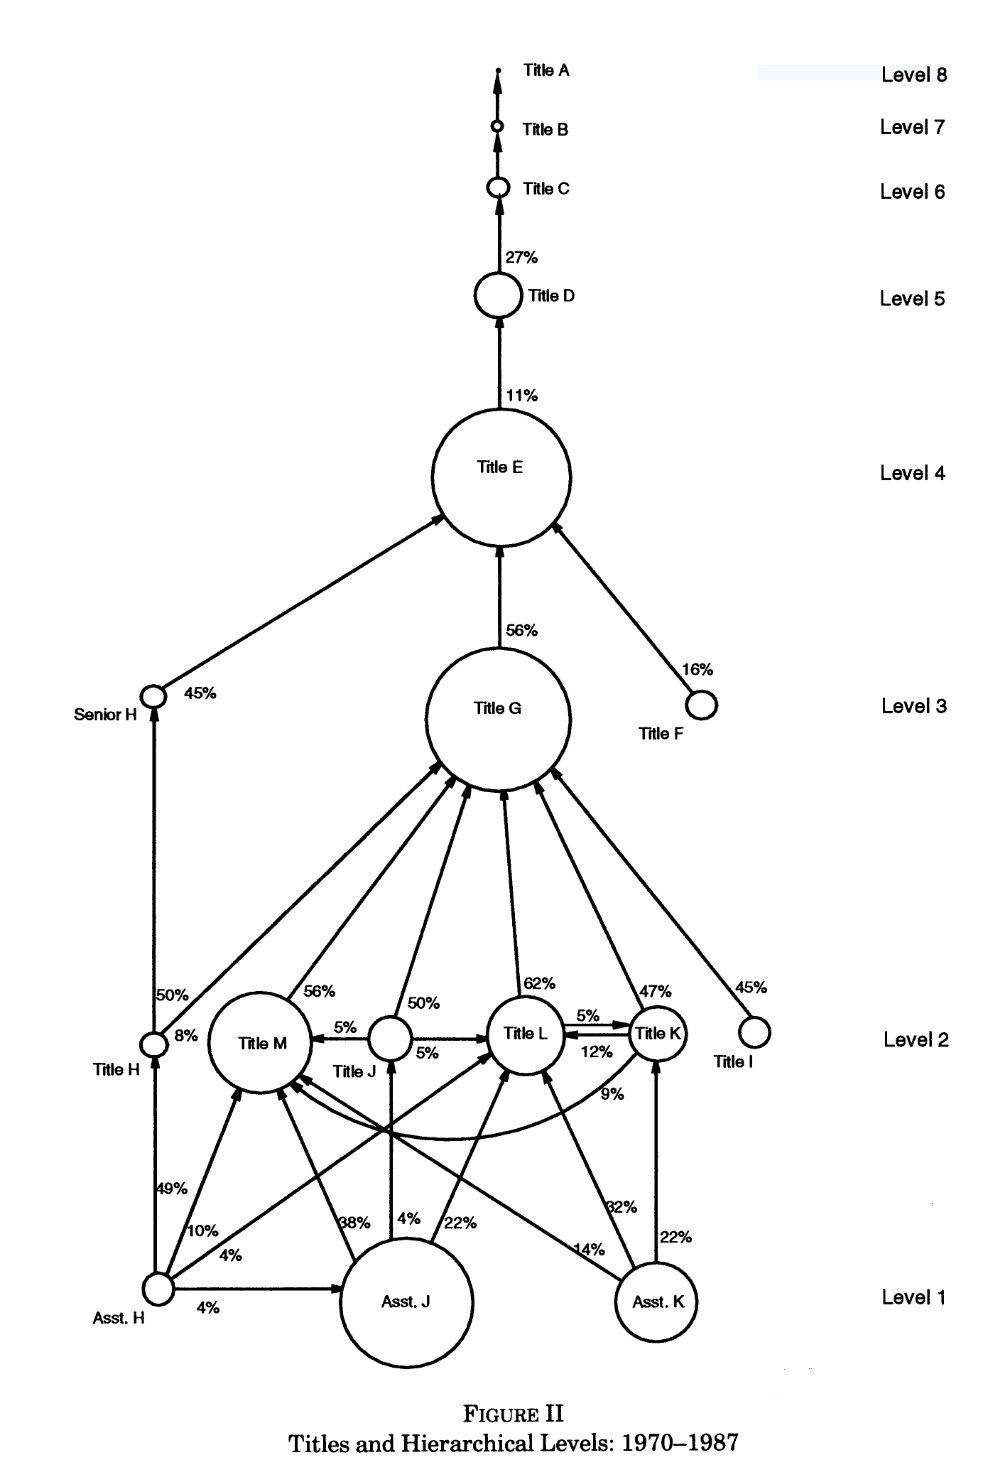
Worker flows inside of firms

We implement the Huitfeldt et al. (2023, J of Econometrics) method

Steps:

  1. Identify largest internal labor market
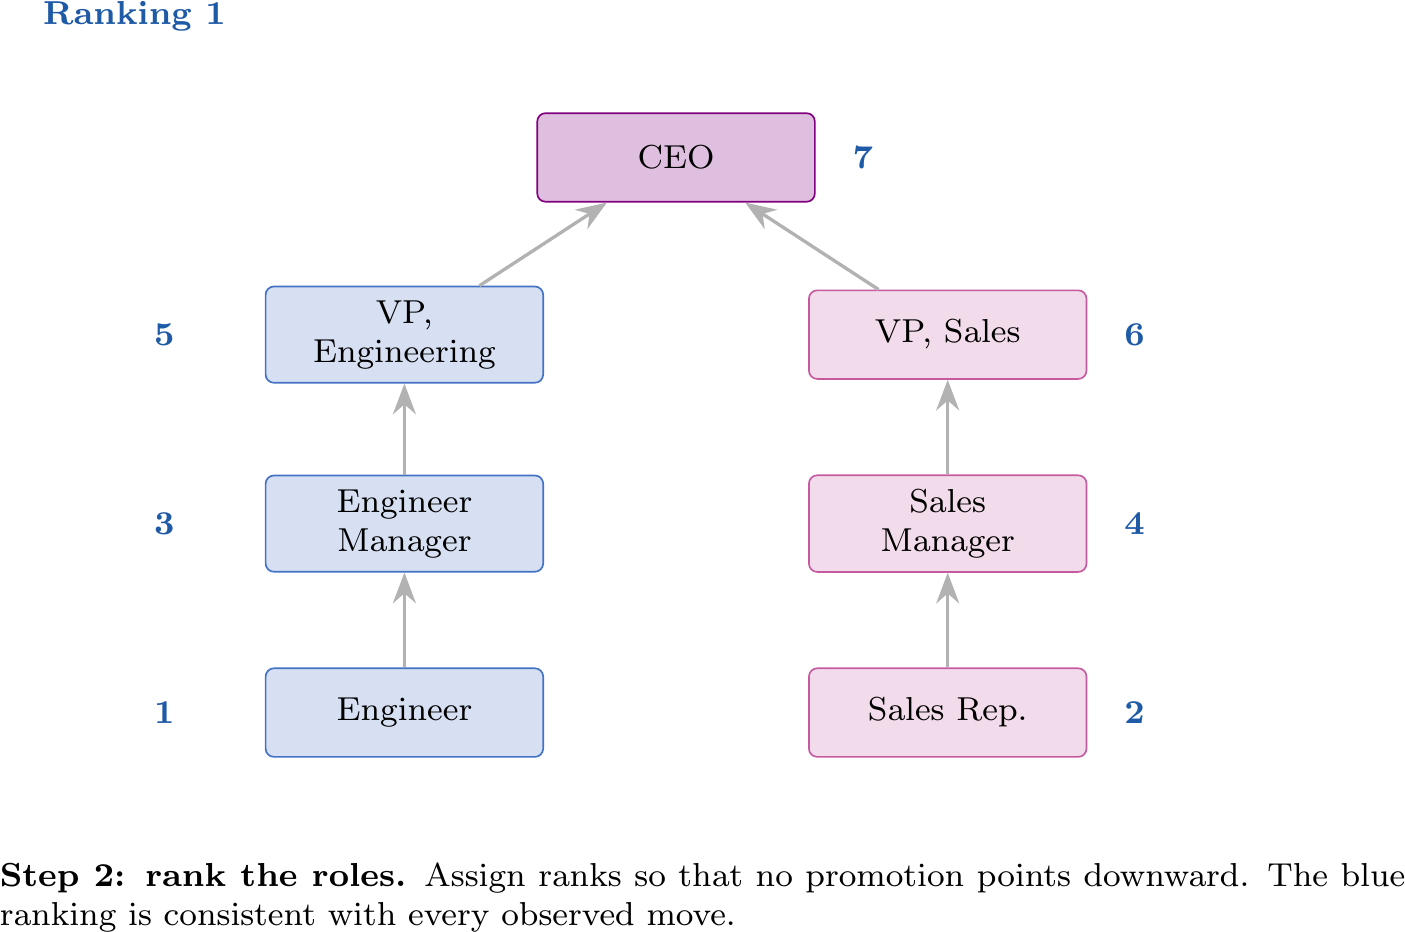
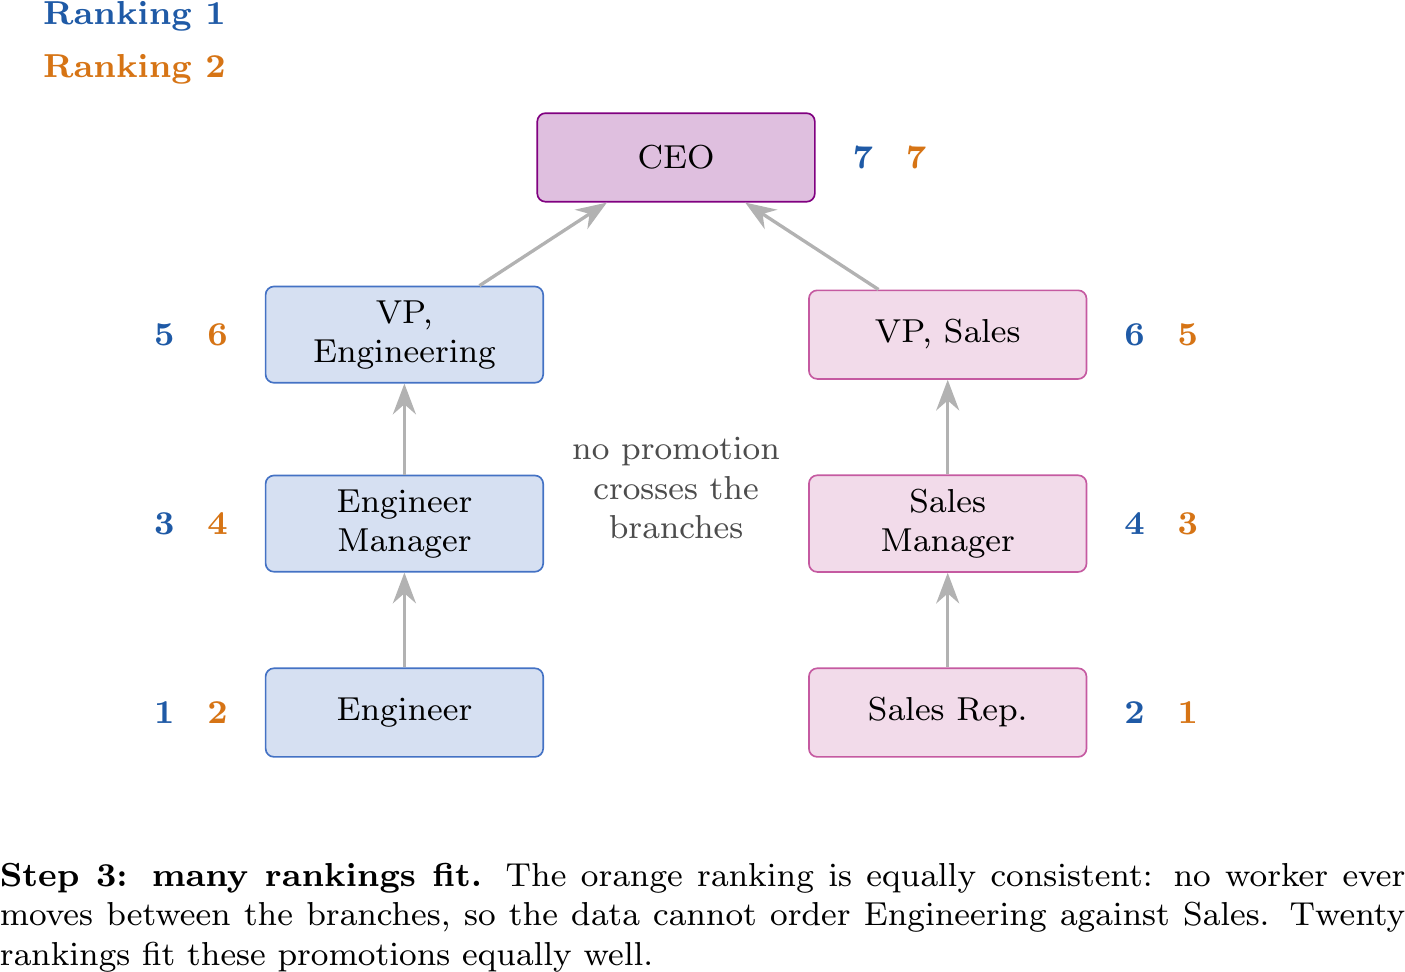
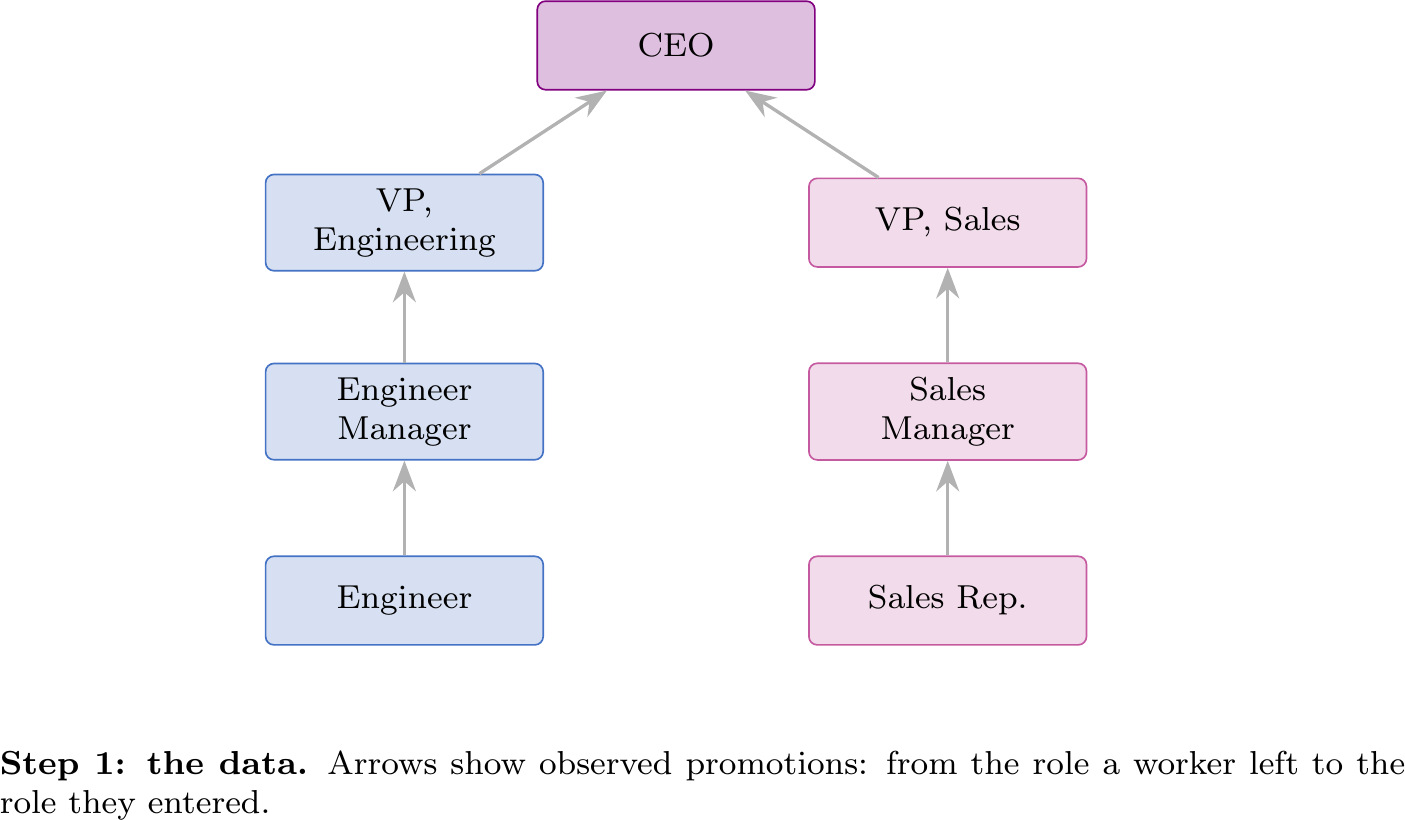
  2. Rank jobs/roles within the largest ILM
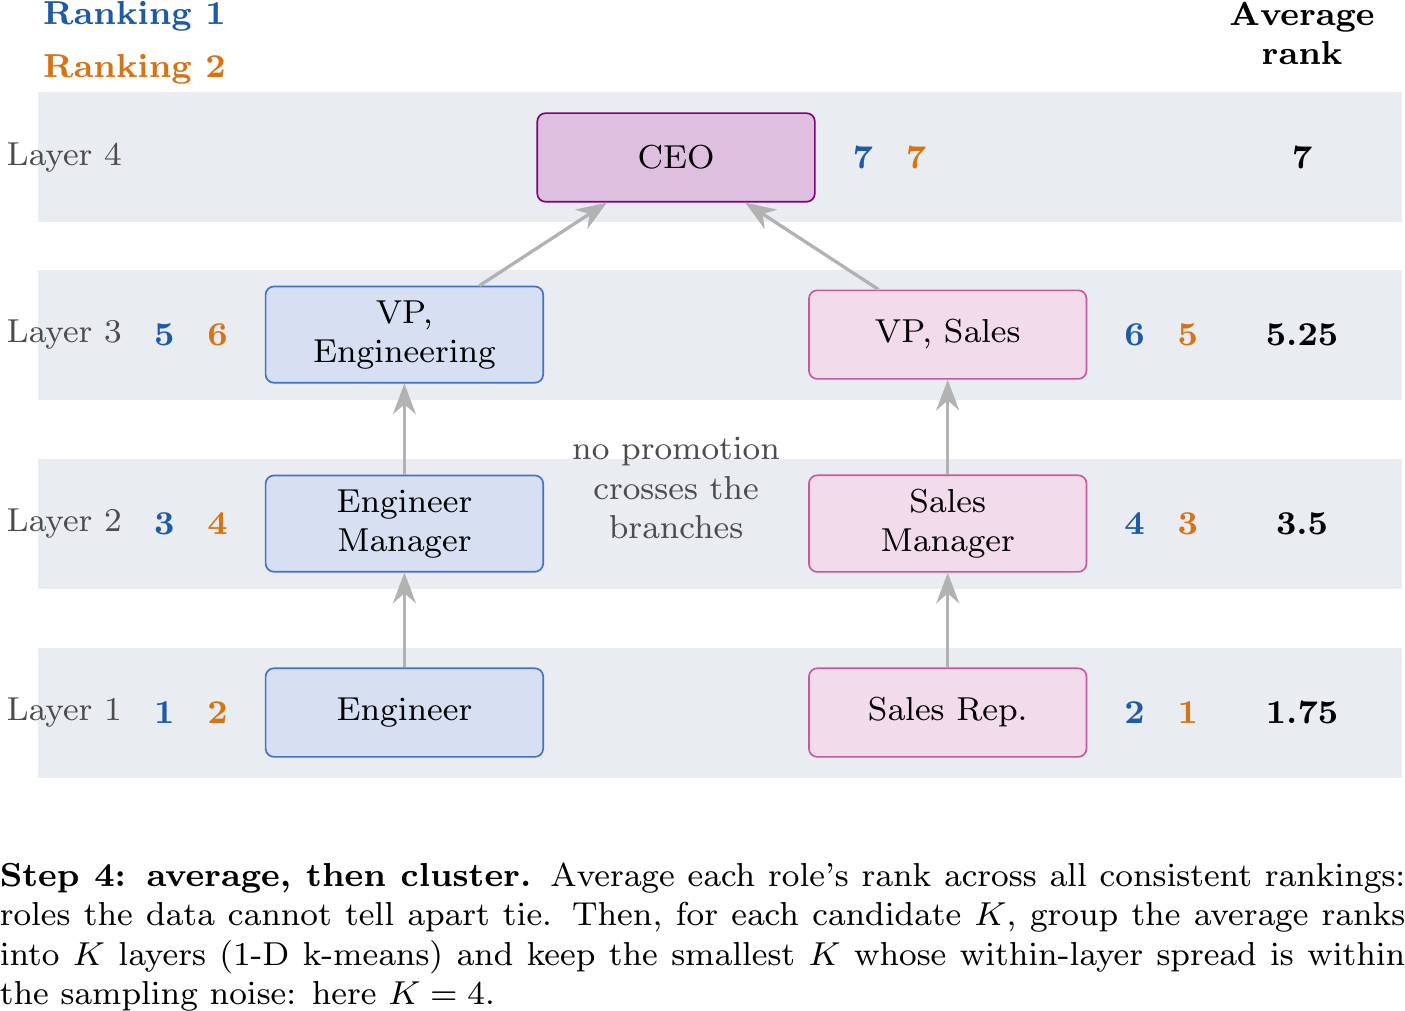
  3. Cluster roles using ranks and signals of lateral moves

Intuition: job transitions reveal the ranking of titles and cluster based on similar ranks

Columbia Business School
Corporate Hierarchy

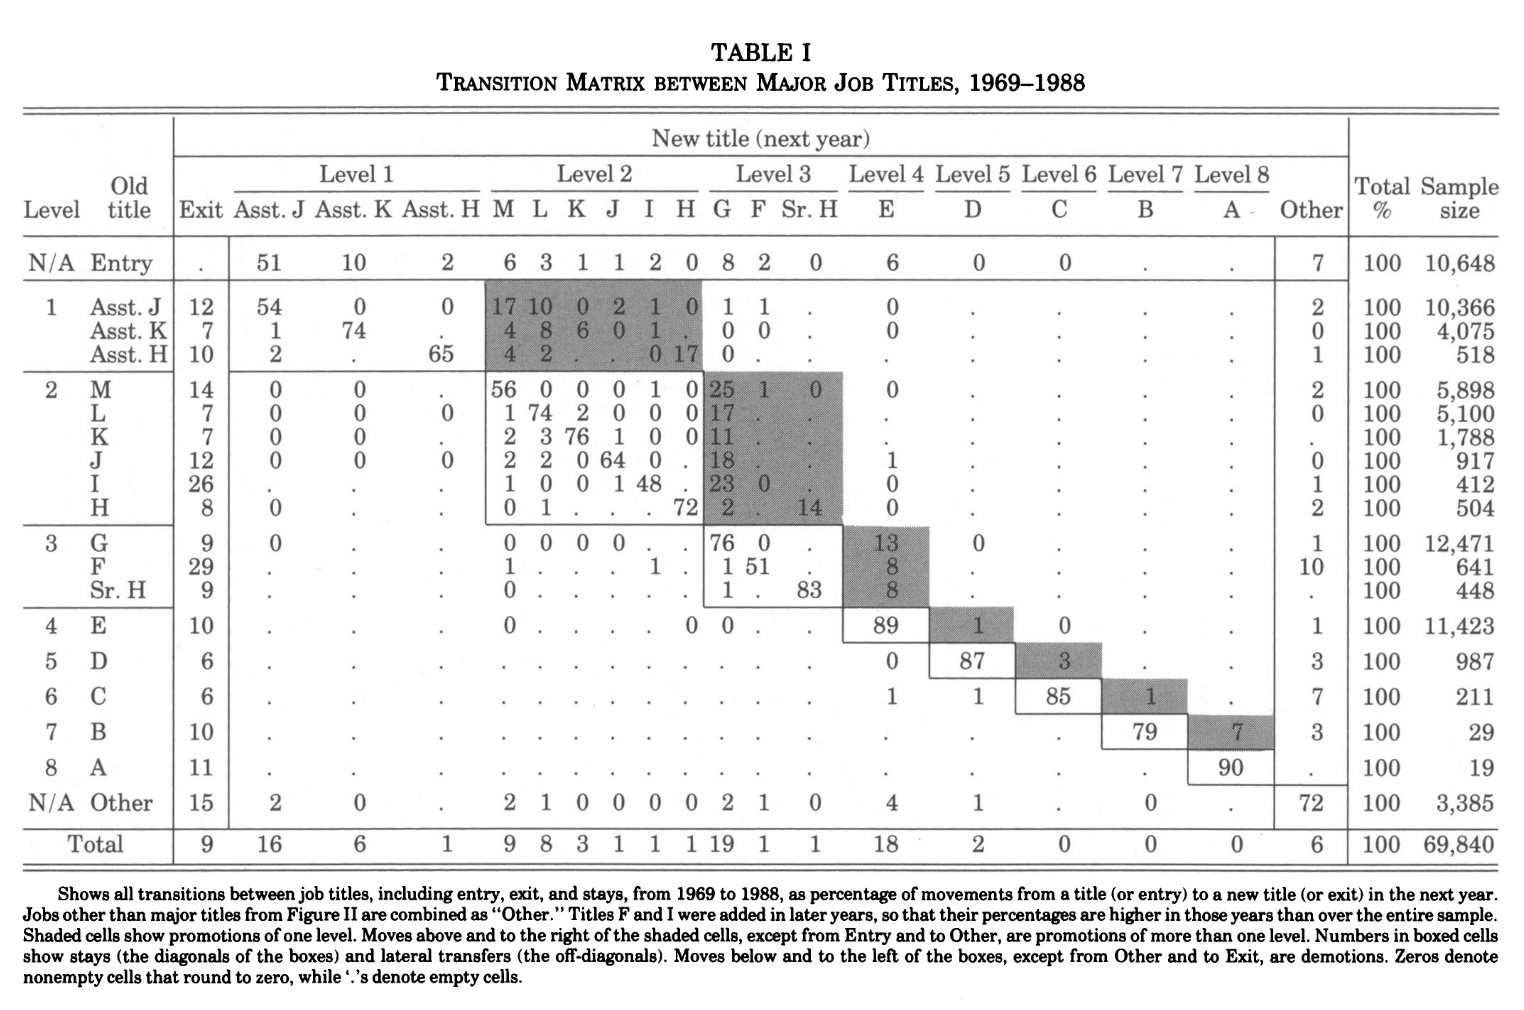
Baker et al. (1994): what transitions reveal
Columbia Business School
Corporate Hierarchy

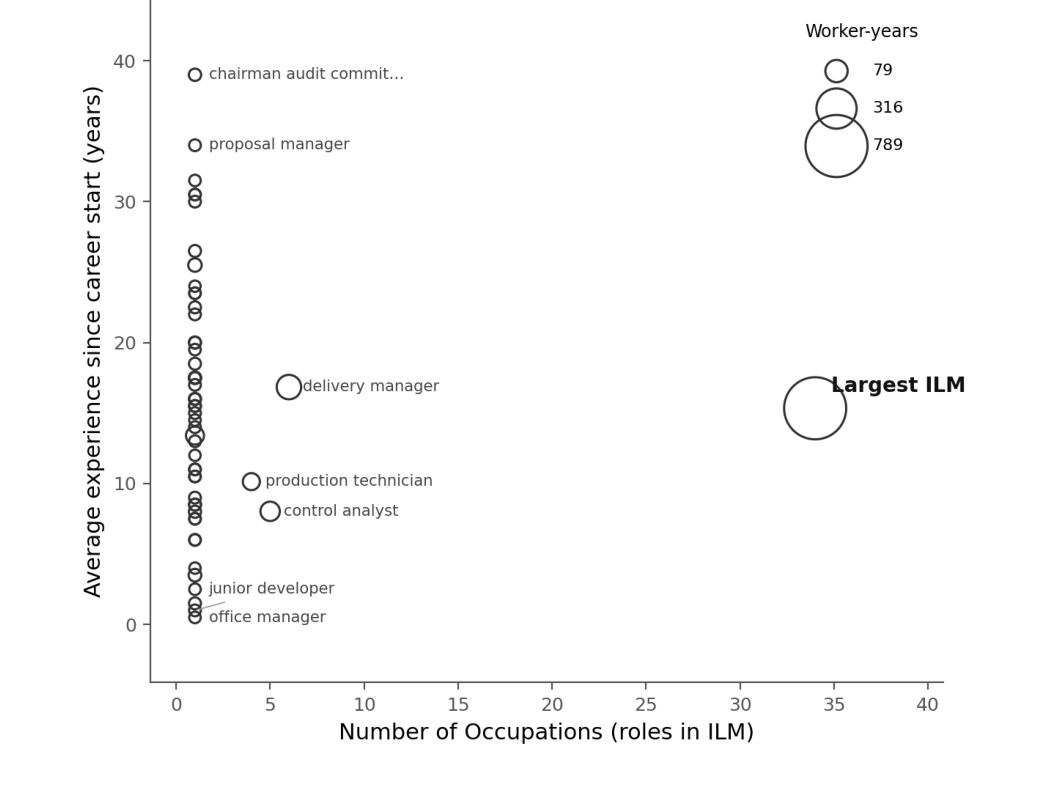
Internal labor markets

  • Find the largest ILM of roles connected by promotion or demotion
Columbia Business School
Corporate Hierarchy

From promotions to layers: toy example
Columbia Business School
Corporate Hierarchy

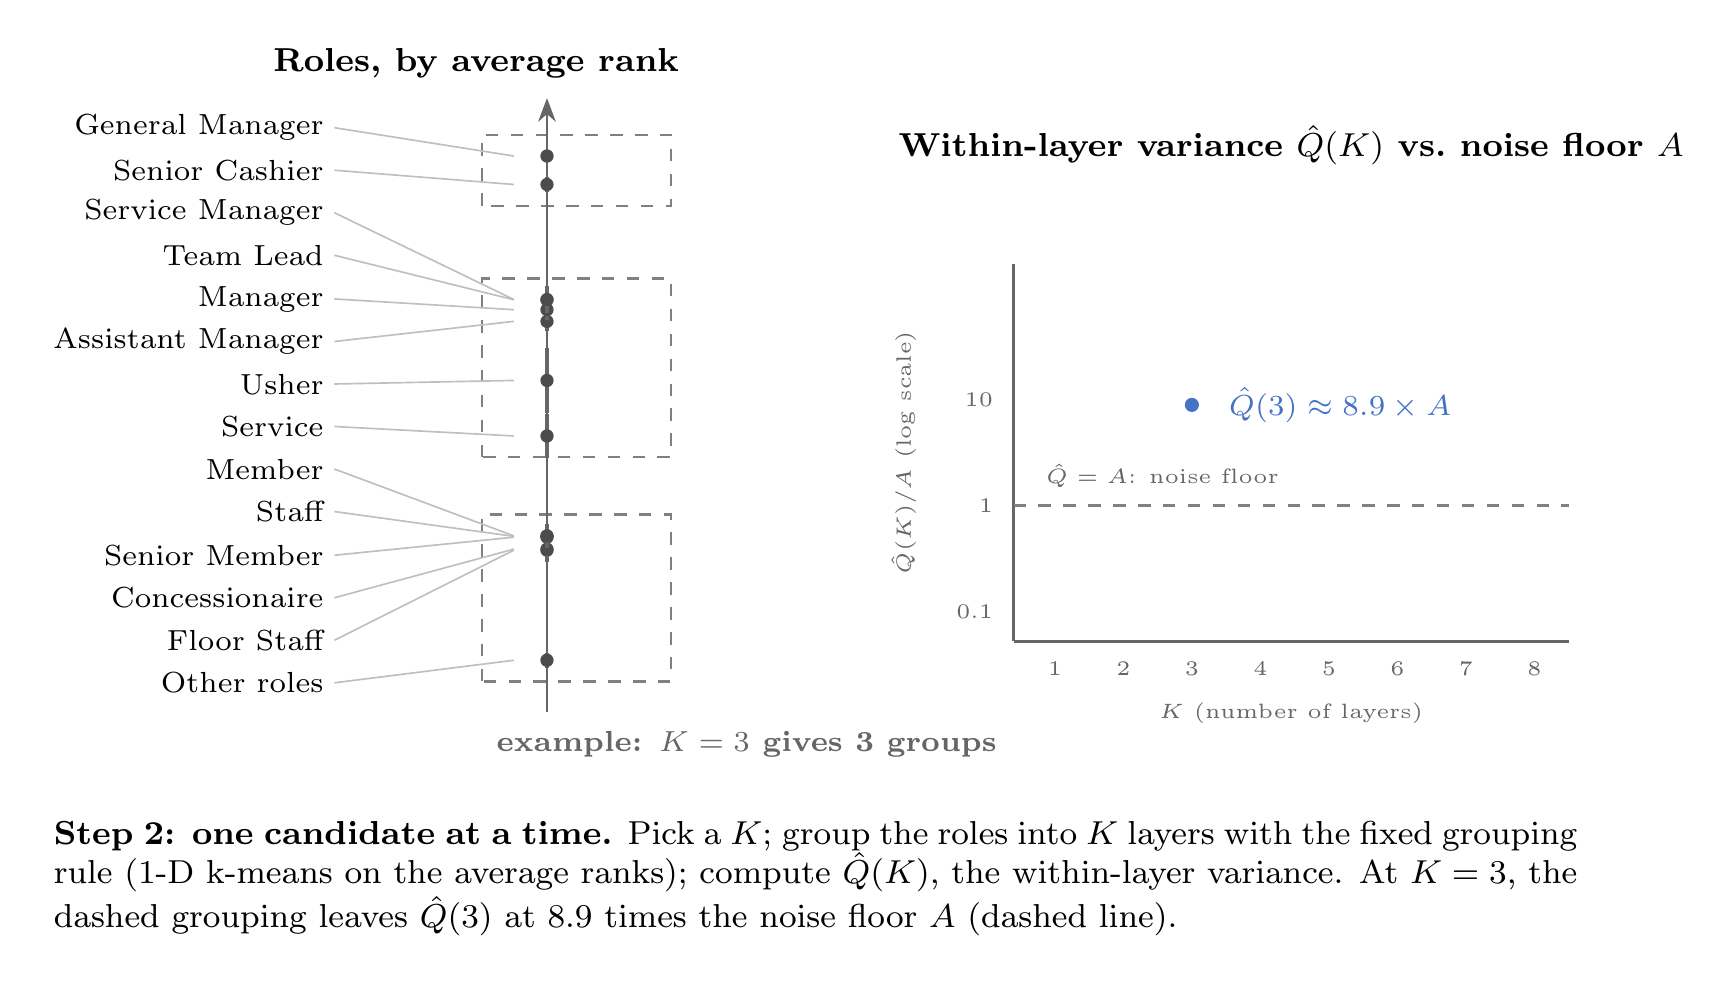
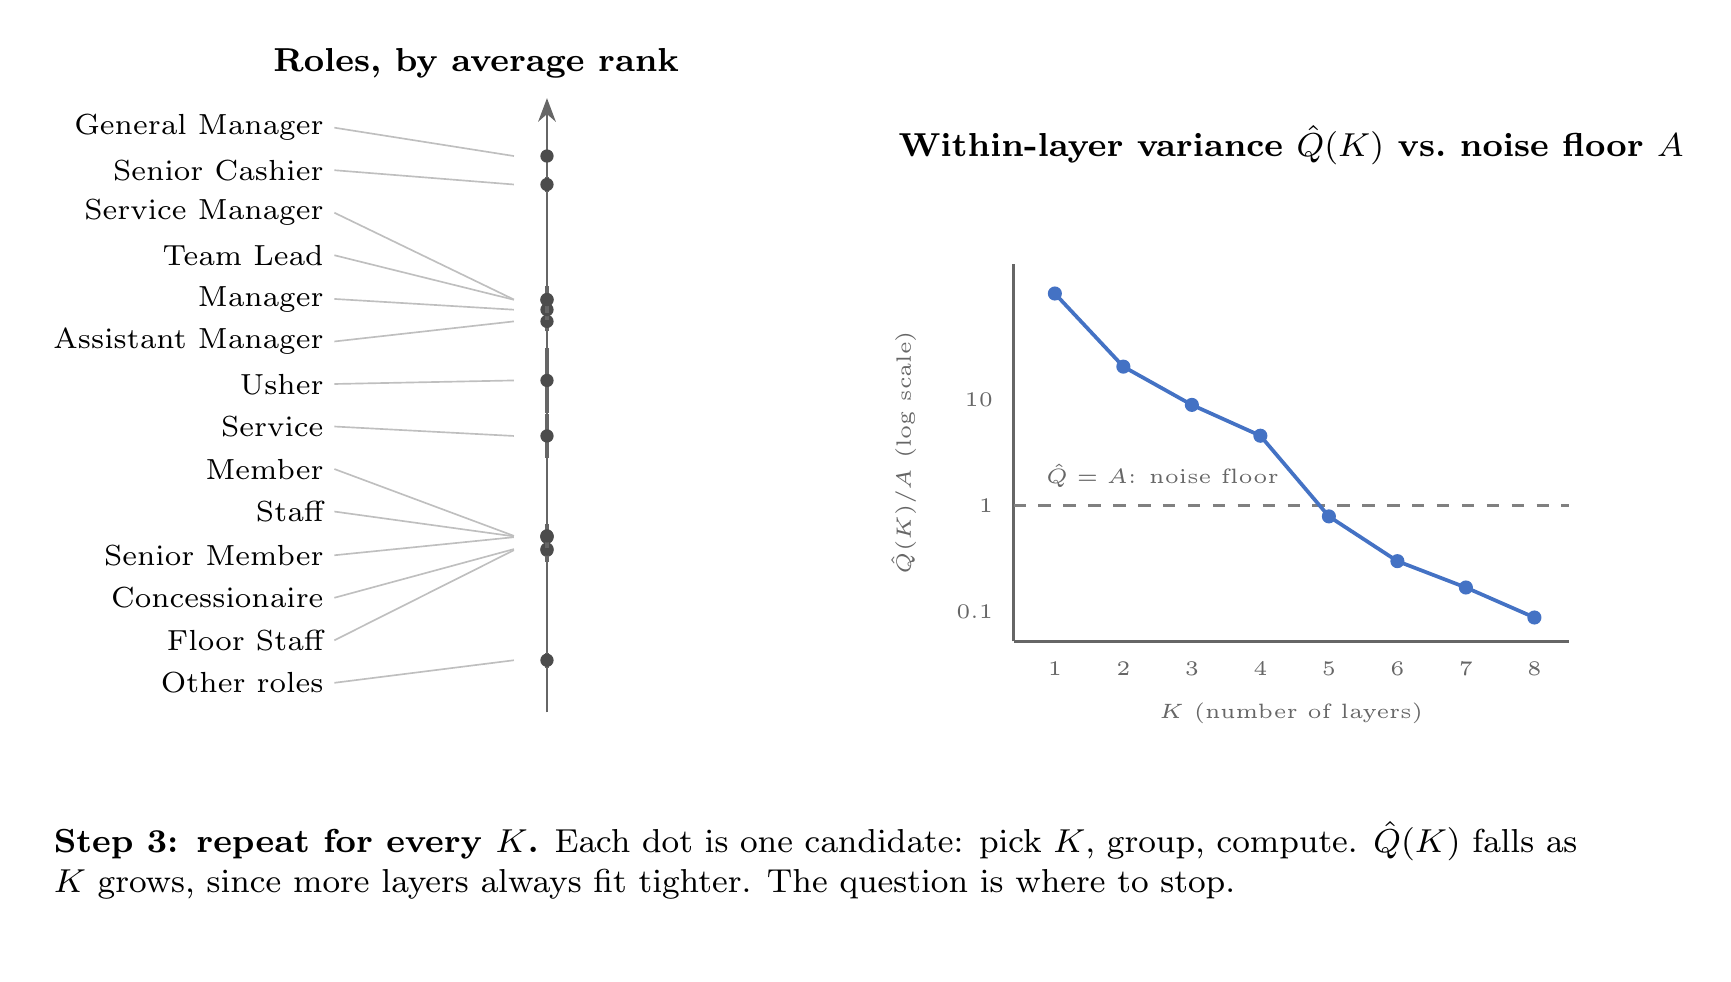
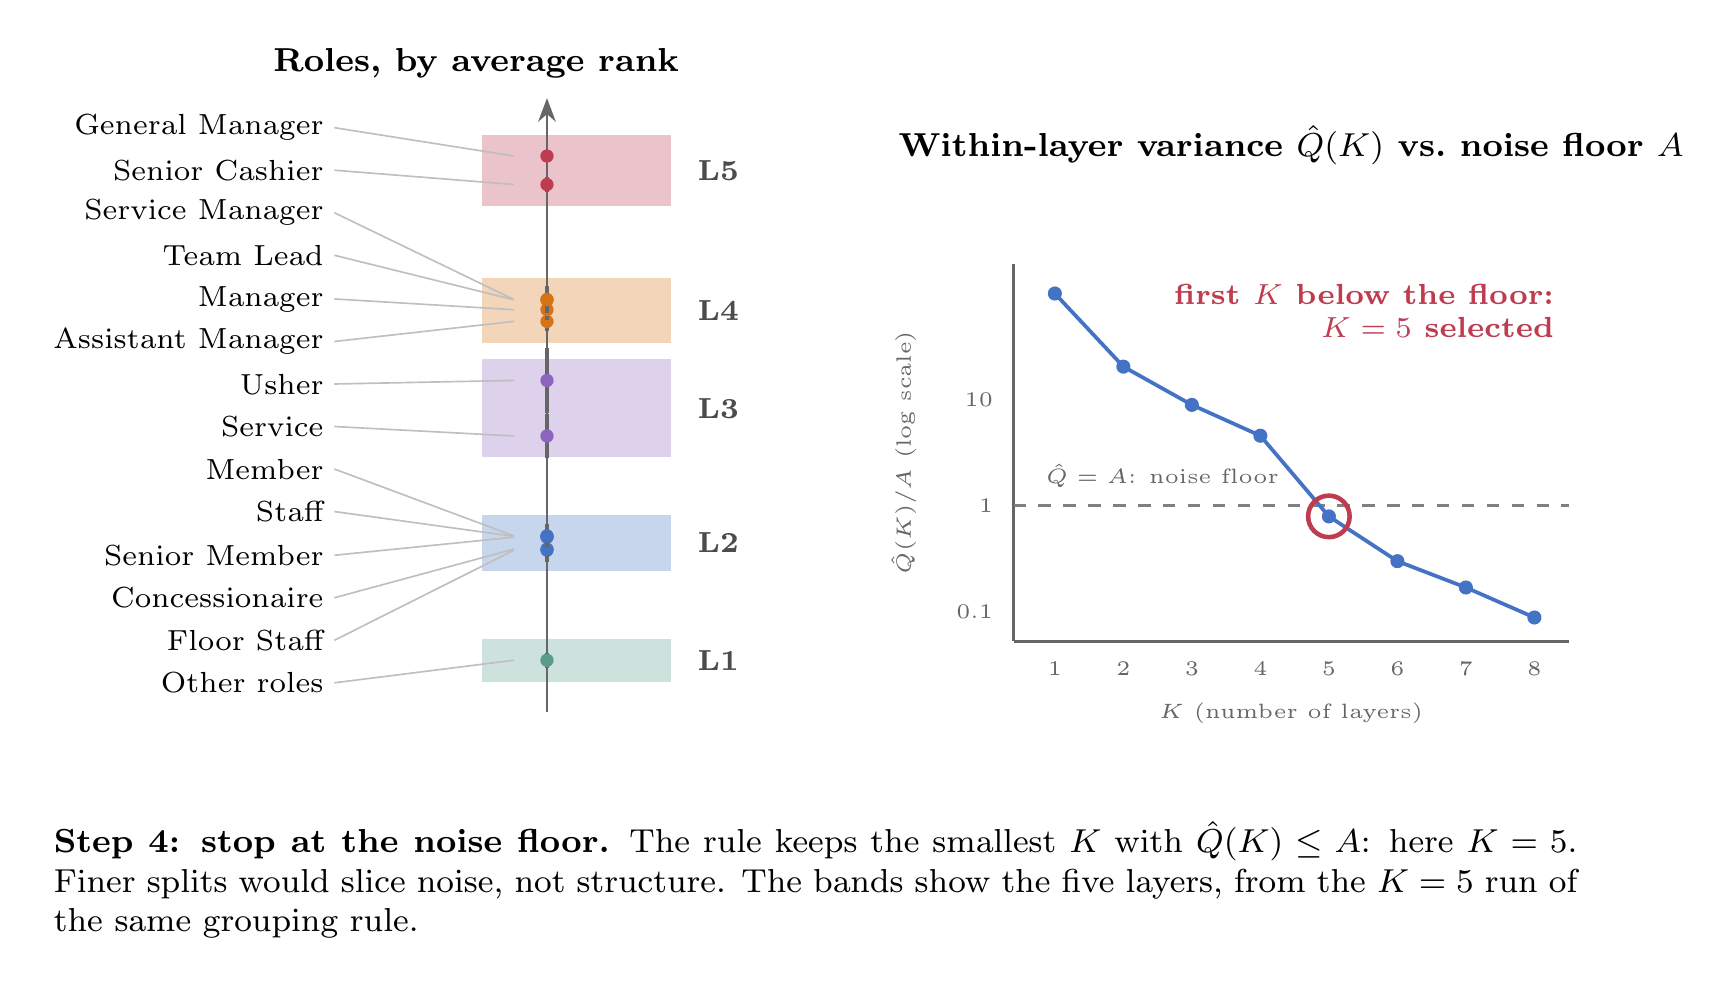
Choosing the number of layers

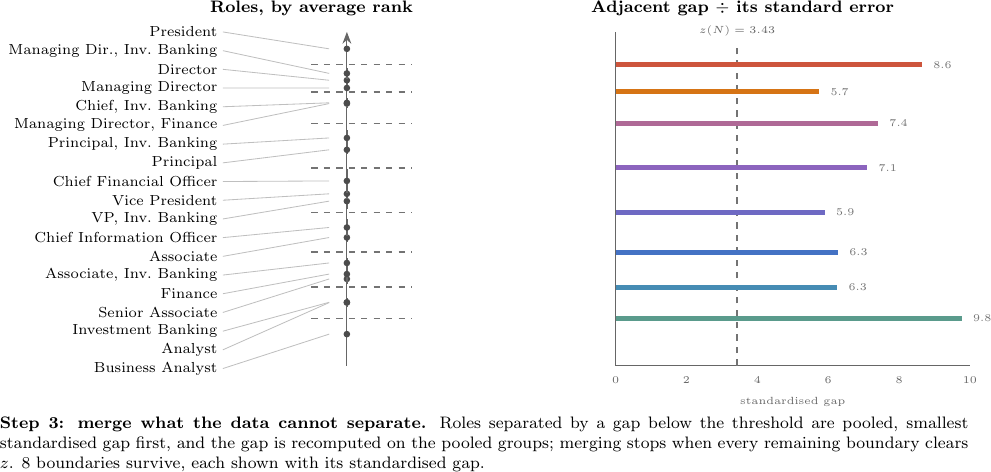
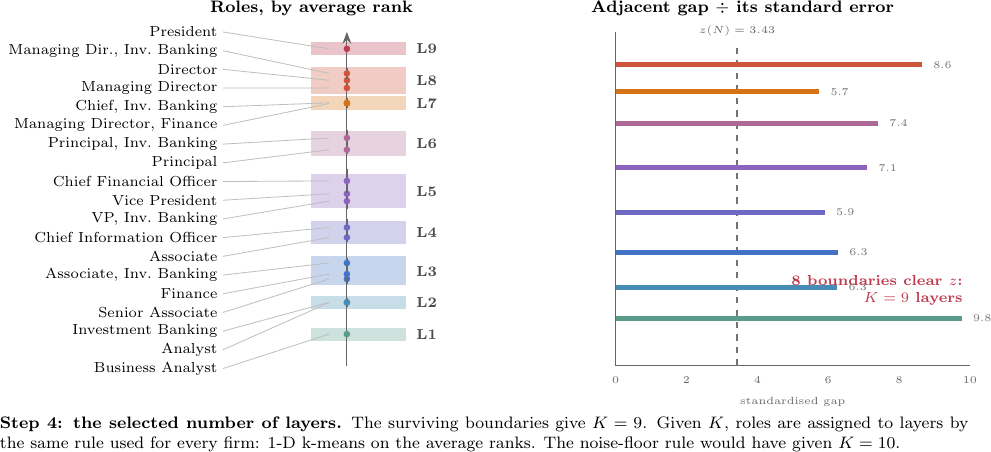
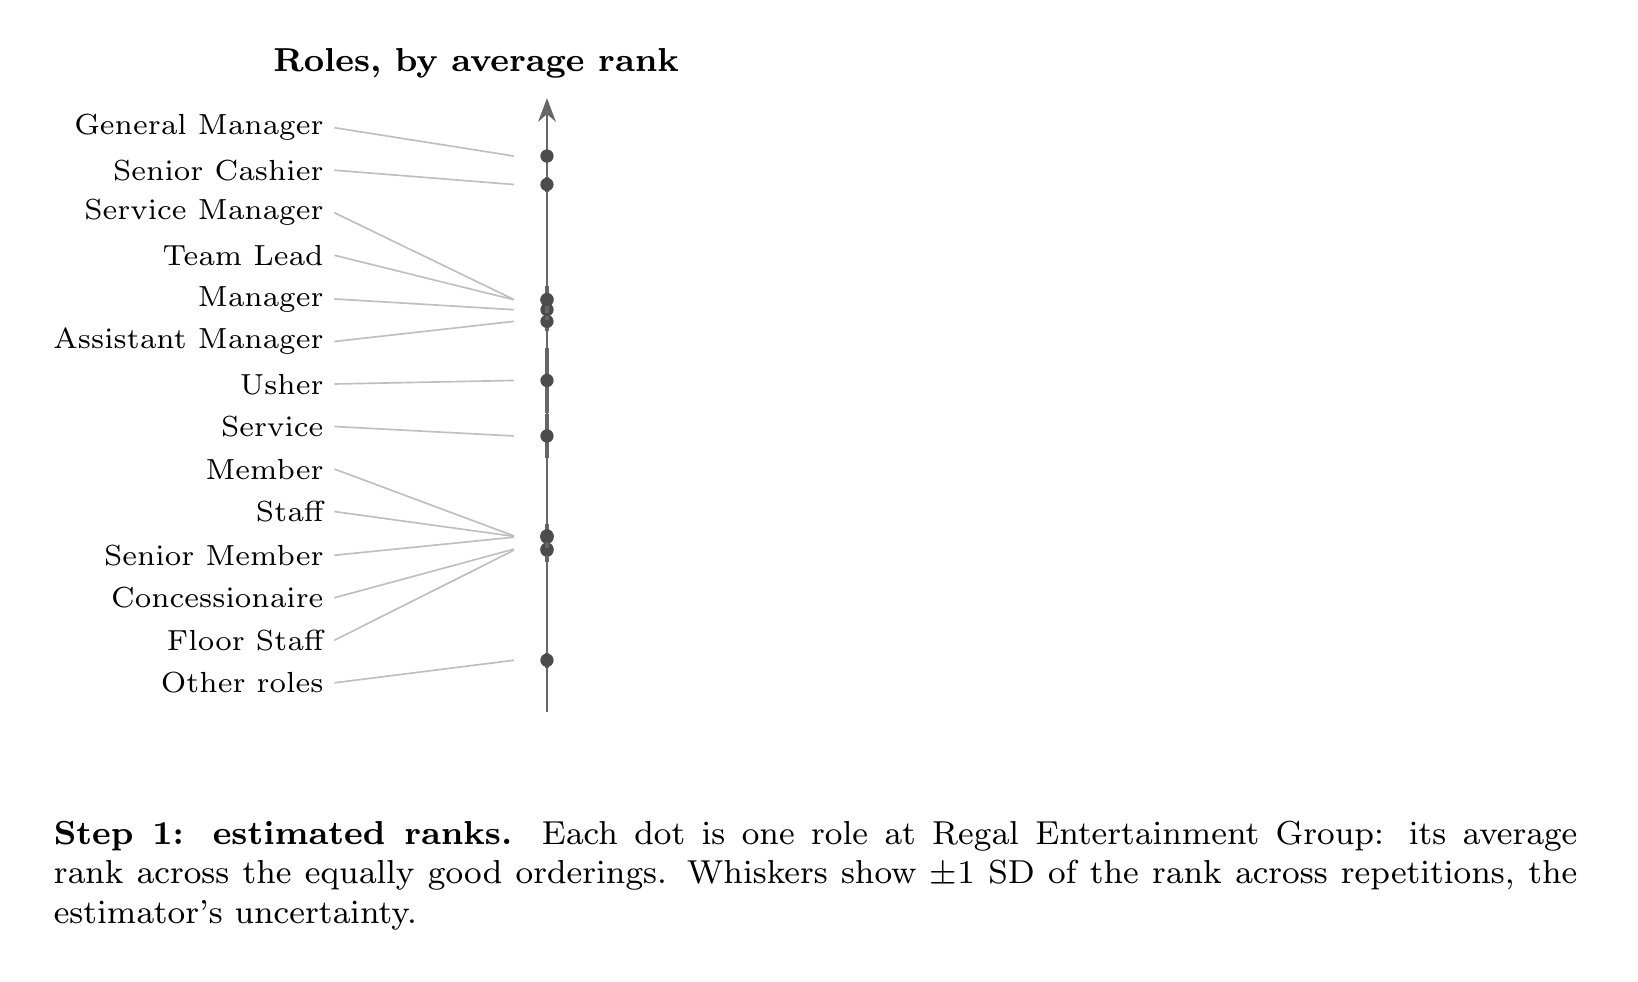
  • Add layers until dispersion of mean ranks inside layers ≤ the noise in the ranks (the noise-floor rule)
  • Given K, every firm uses the same 1-D k-means assignment of roles to layers
Columbia Business School
Corporate Hierarchy

Real firm: Regal Entertainment
Columbia Business School
Corporate Hierarchy

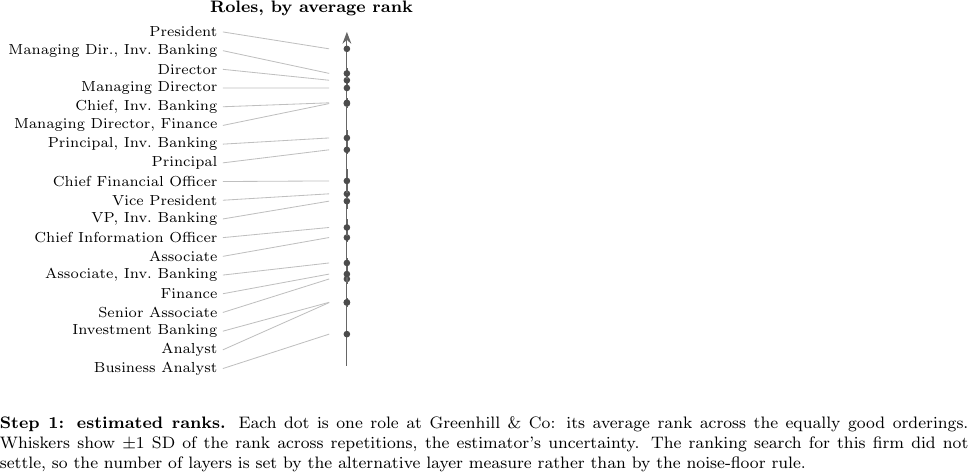
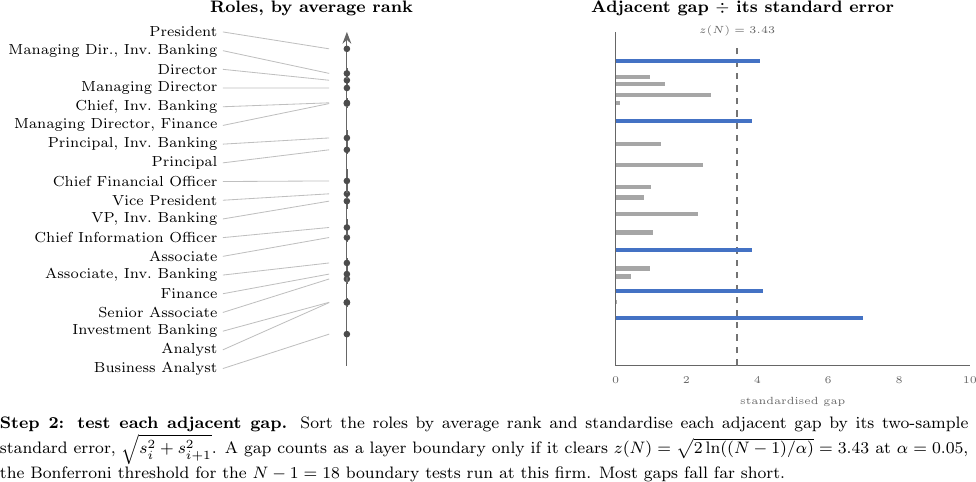
The alternative rule: Greenhill

  • Large promotion-heavy firms with many incomparable roles: the search does not settle
  • Alternative rule: merge neighboring roles until gaps exceed the Bonferroni family-wise threshold
  • Supplies K for 1,492 firms (43%)
Columbia Business School
Corporate Hierarchy

Merge LinkedIn to Compustat (and more)

  • Compustat baseline; Execucomp fills missing CEOs / top management
  • CRSP, BoardEx, DISCERN/KPSS (patents), SDC (mergers), Babina et al. (2024) AI
Columbia Business School
Corporate Hierarchy
Data and representativeness
Worker job histories and public firms
Motivation
Theory
Measurement
Data and representativeness
Validation
Outcomes
What explains layers
Conclusion
Columbia Business School
Corporate Hierarchy

Goal: worker histories with public firms

  • Two vendors: Revelio (2013–2024, default) + CoreSignal (longer histories; used where Revelio inadequate)

Titles → Roles
Columbia Business School
Corporate Hierarchy

Sample construction

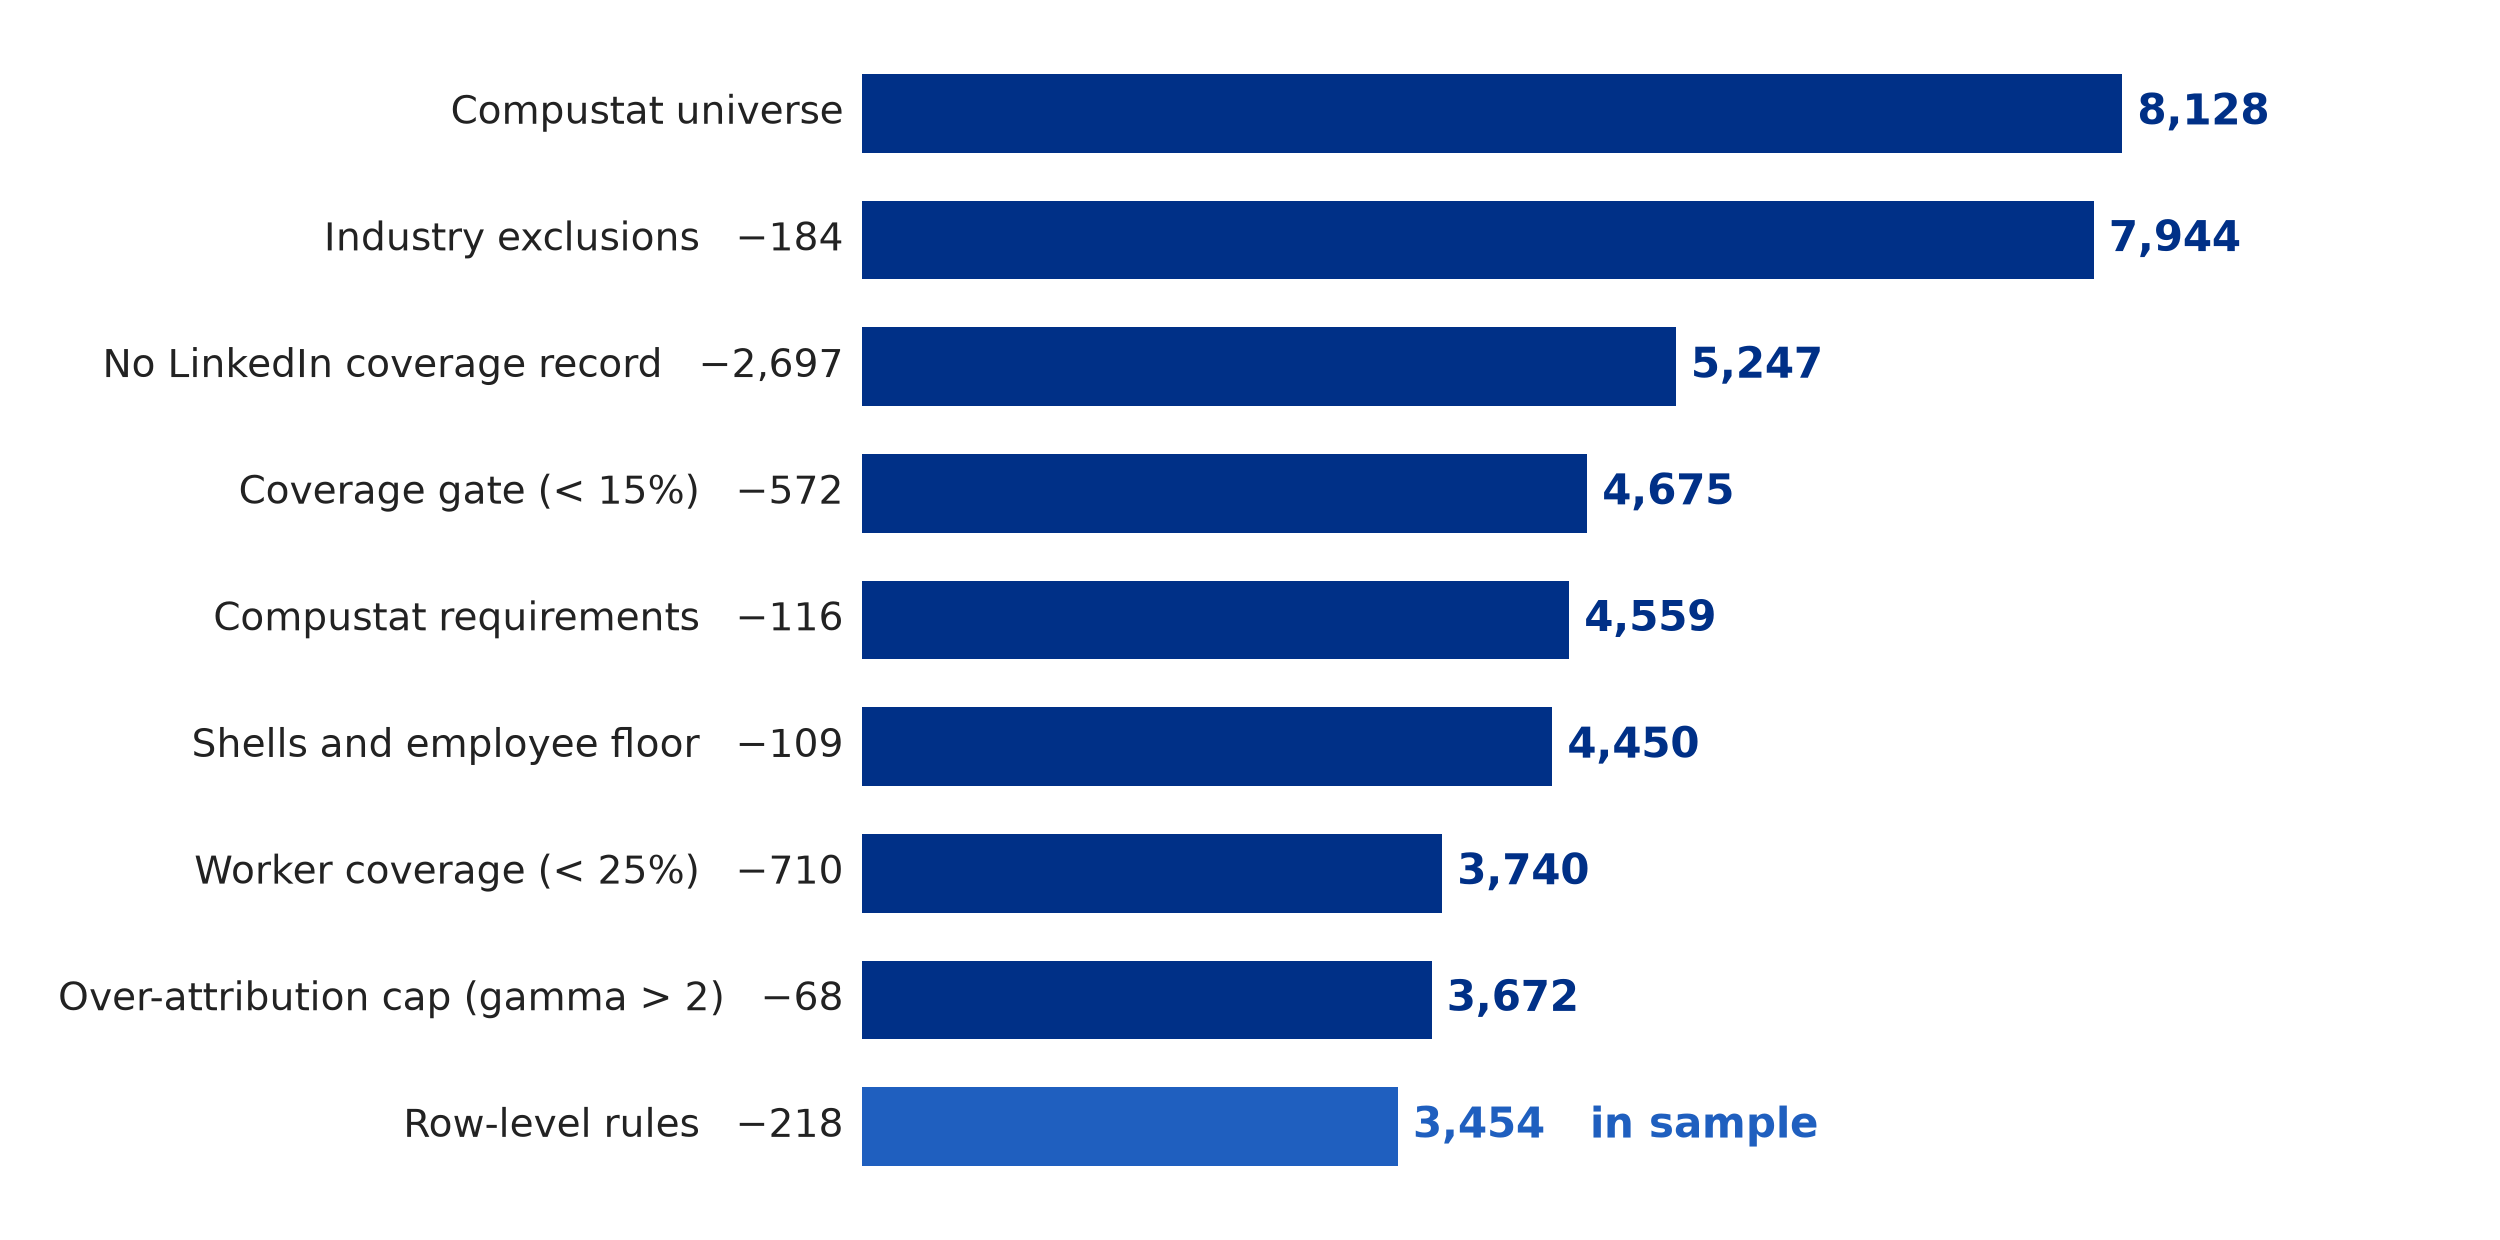
  • Universe: 8,128 matched firms
  • Gates: industry exclusions; LinkedIn/Compustat coverage ≥ 15%; largest-ILM worker share ≥ 25%; Compustat requirements; shells/employee floor; γ>2 cap
  • Final sample: 3,454 firms / 26,112 firm-years, fiscal years 2015–2024; panels 2013–2024
Columbia Business School
Corporate Hierarchy

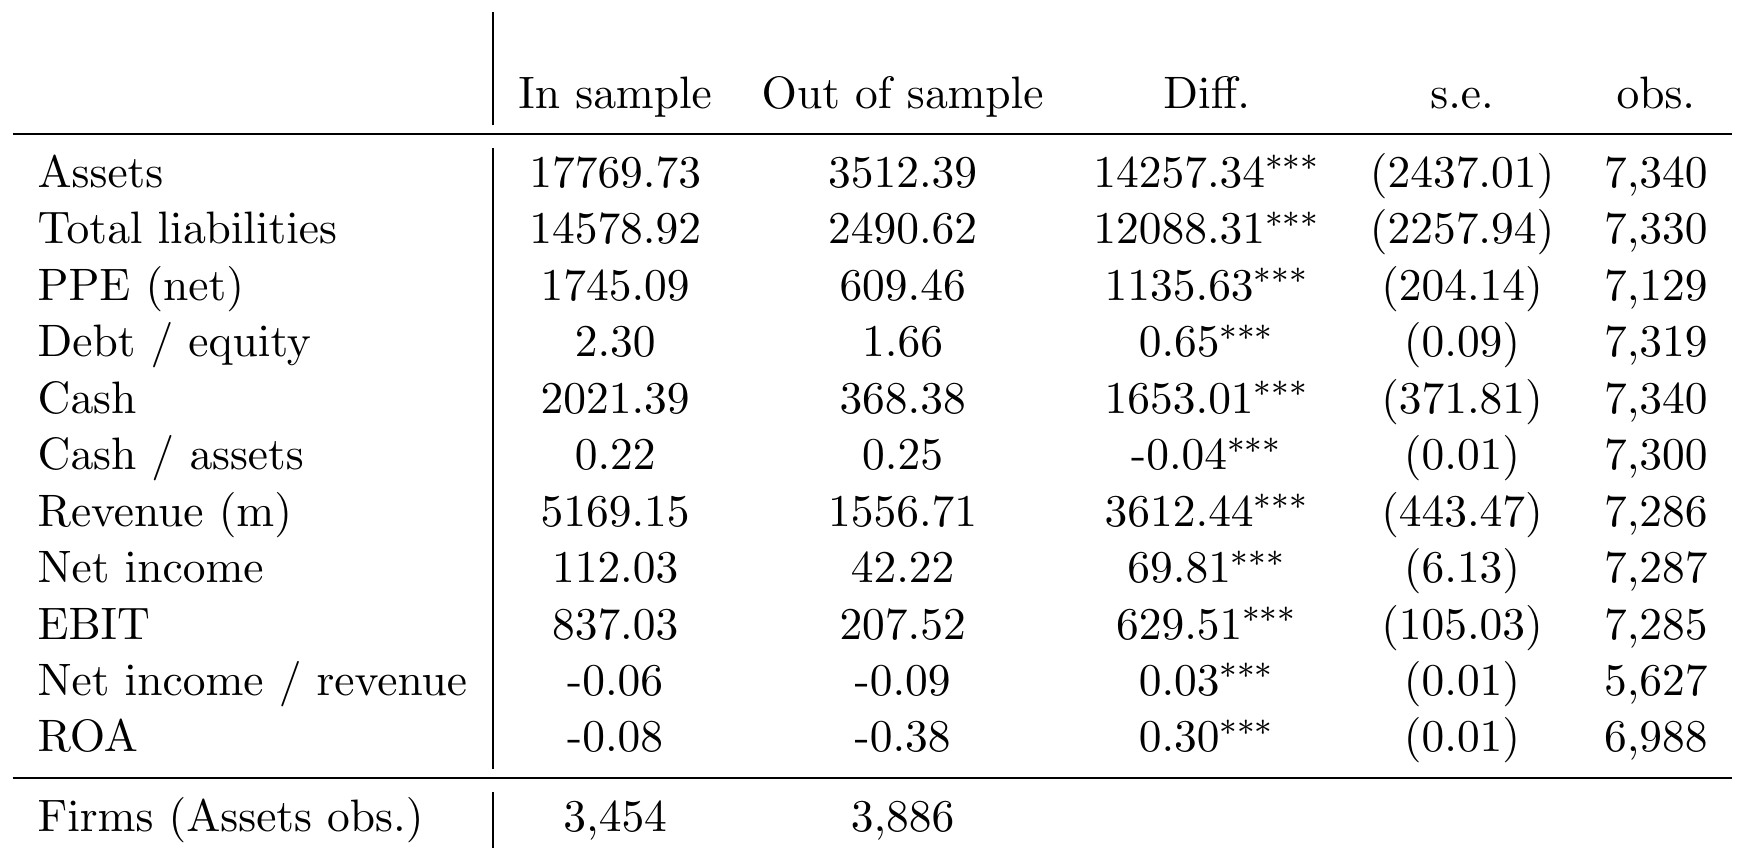
In and out of sample differences

  • In-sample firms are larger, more levered, higher-level profits (directions unchanged)
Columbia Business School
Corporate Hierarchy

Summary statistics
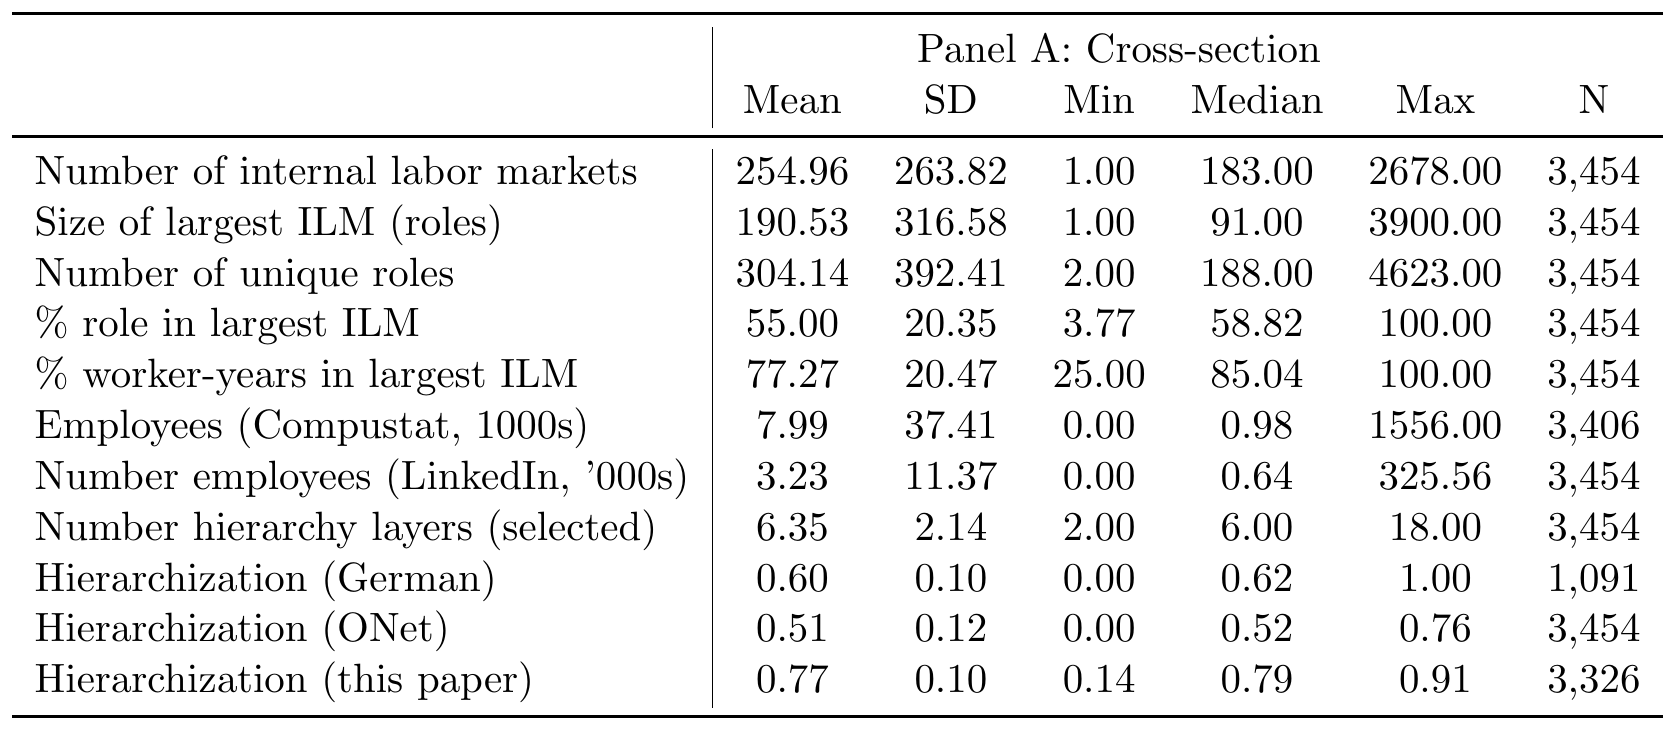
Algorithm rules
Not all employees
Columbia Business School
Corporate Hierarchy

Layers over time: flat to weakly increasing

  • Mean 6.39 (2015) → 6.55 (2024); median 6 throughout
  • 19% of firms ever change their layer count
[FIGURE 1 PENDING: time_series_v3.png rerun]
Columbia Business School
Corporate Hierarchy

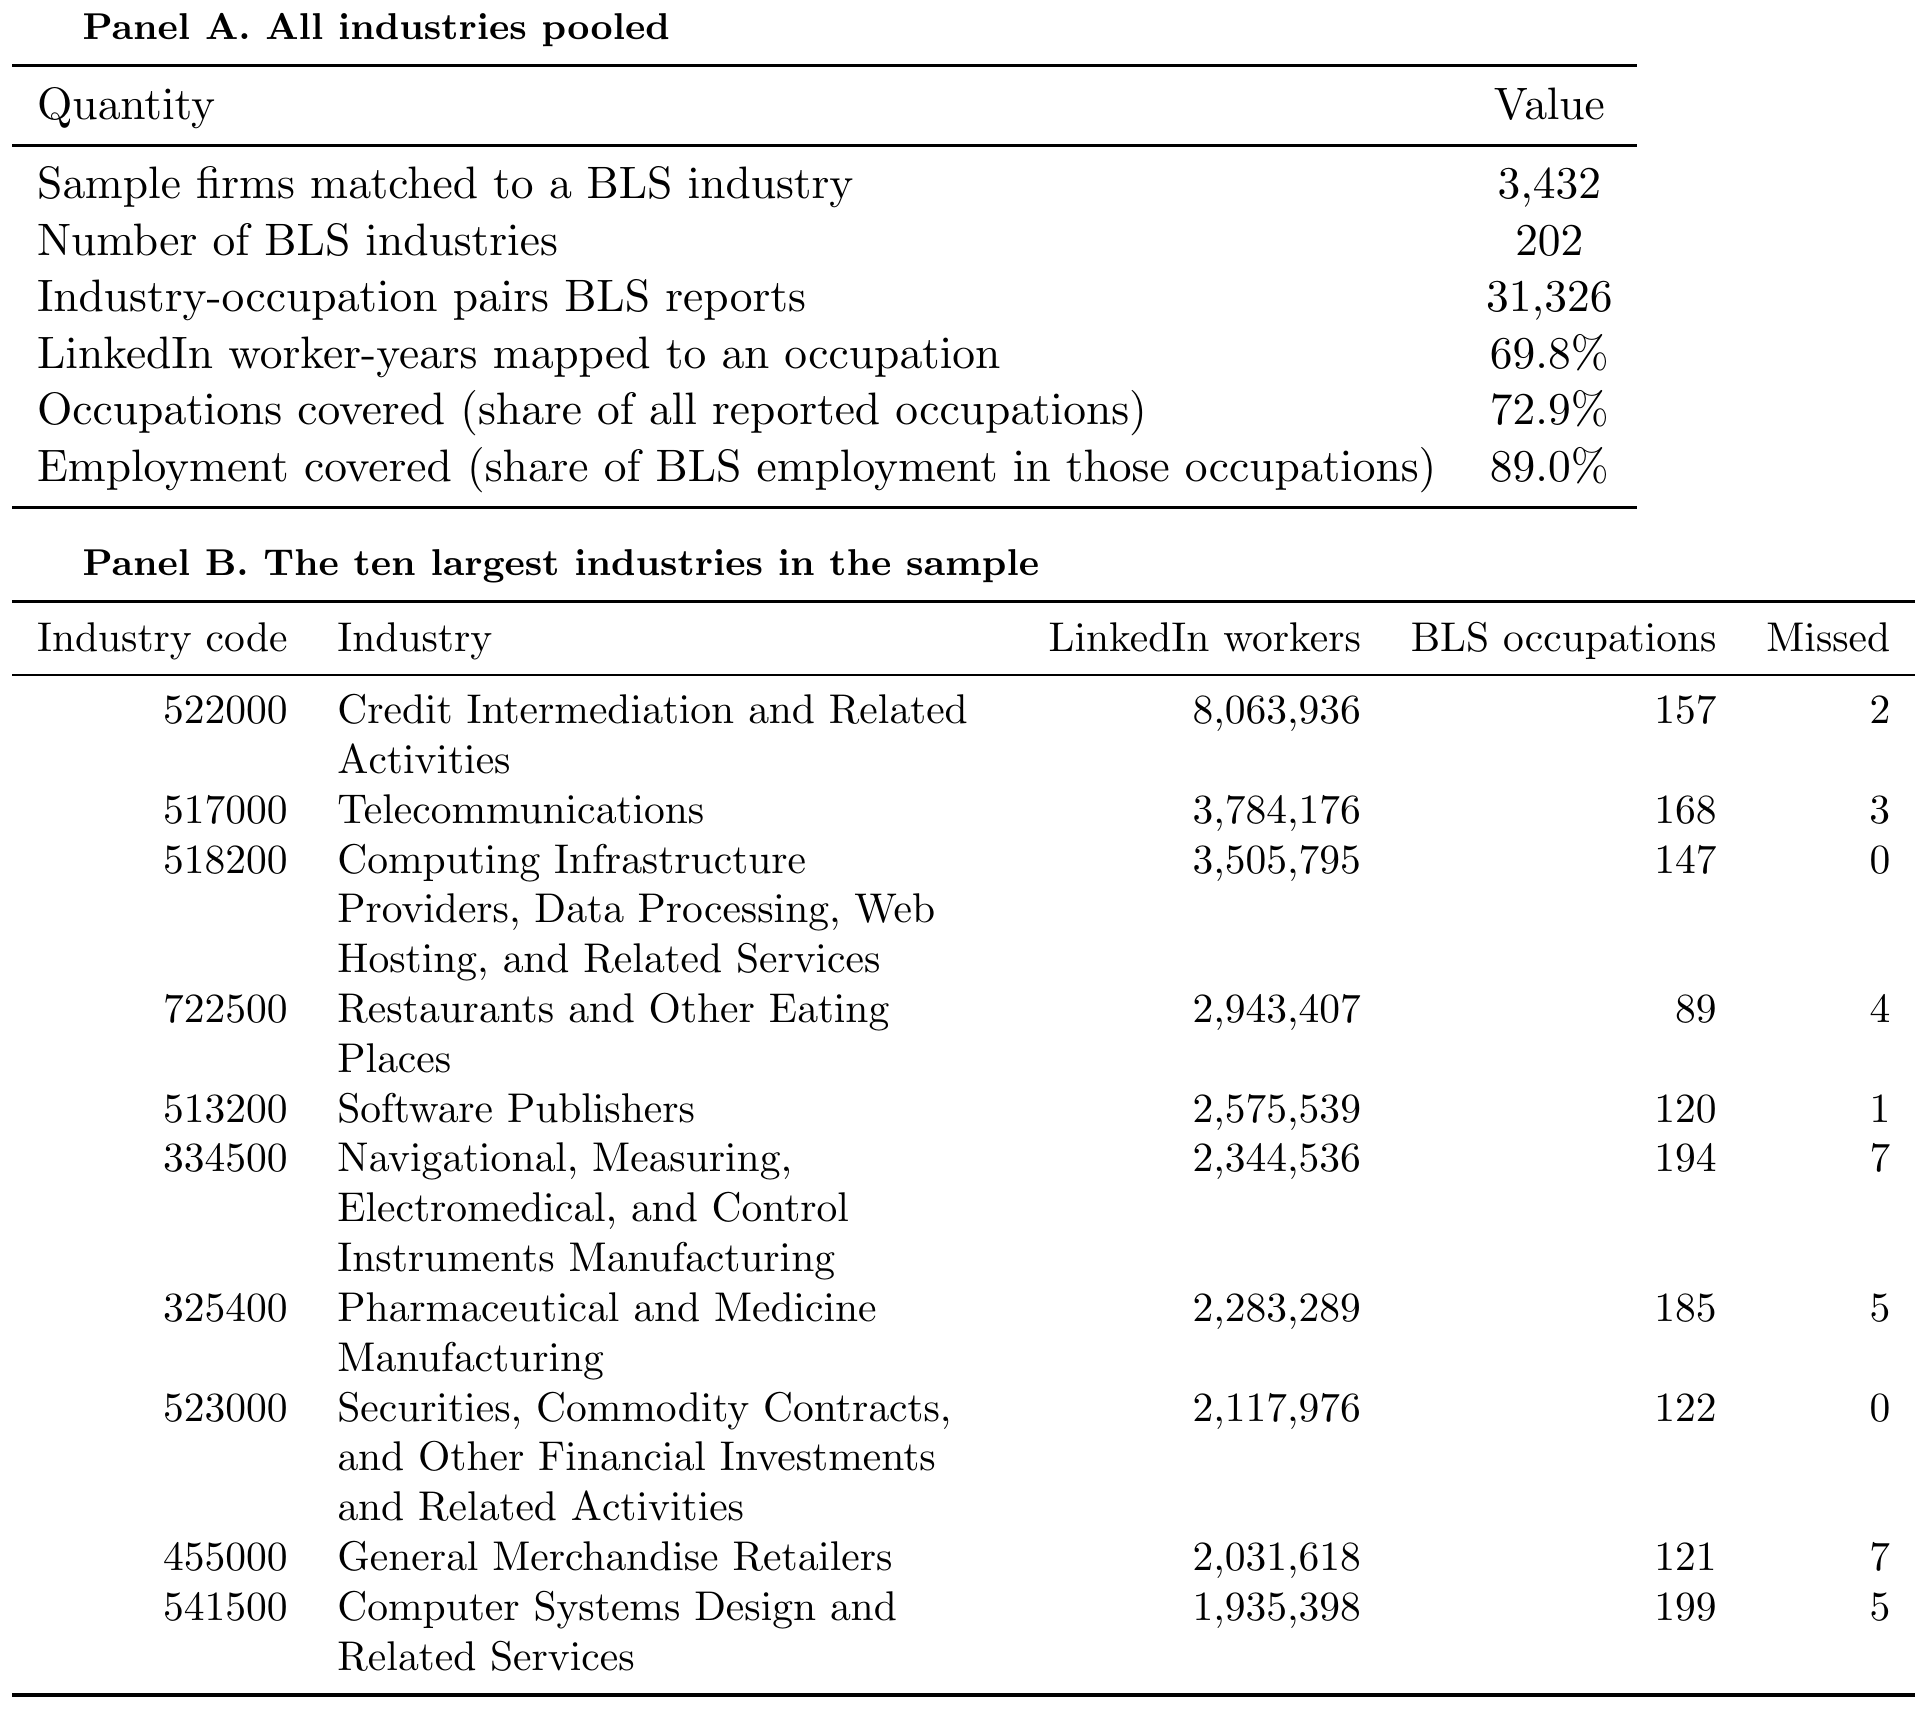
Is LinkedIn representative? BLS comparison

  • Covers 73% of reported occupations and 89% of BLS employment in them
  • Occupations absent industry-wide: mid-pay nationally
  • Occupations absent within a firm: lower-pay relative to that firm, sit mid-rank or off the main ILM
  • Undercounted workers: the bottom of the firm
Columbia Business School
Corporate Hierarchy

Does missingness bias the count? Simulation

  • Synthetic firm with known structure; degrade coverage the way LinkedIn is incomplete; re-run the estimator
  • At the measured gaps, the true layer count is recovered; breaks only at extreme truncation
Columbia Business School
Corporate Hierarchy
Validation
Motivation
Theory
Measurement
Data and representativeness
Validation
Outcomes
What explains layers
Conclusion
Columbia Business School
Corporate Hierarchy

What should a measure look like?

With a new measure comes a new responsibility: convince you it is hierarchy.

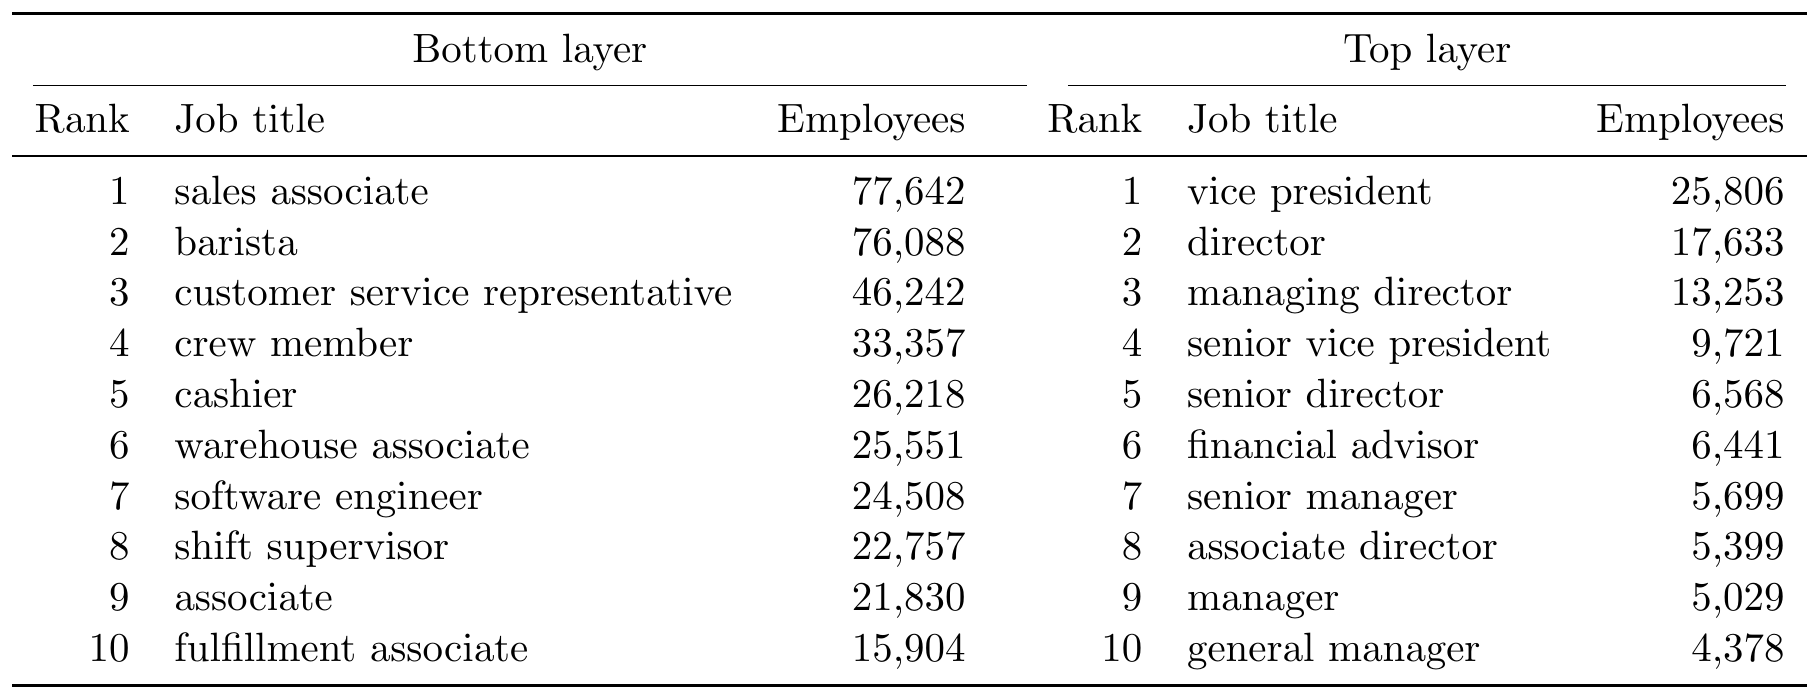
  • intuitive titles and roles in hierarchical layers
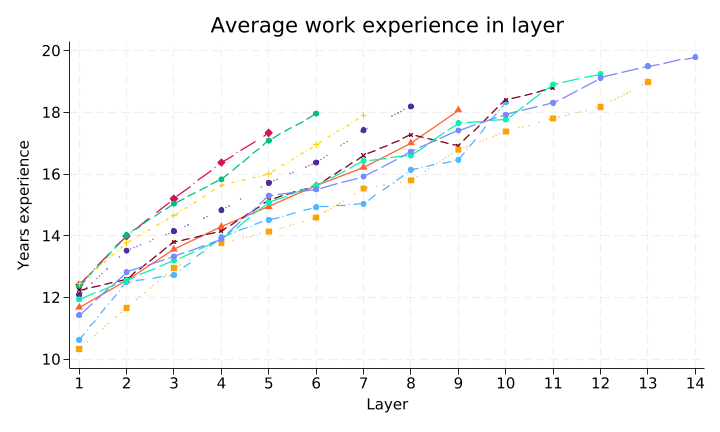
  • higher layers → more experience
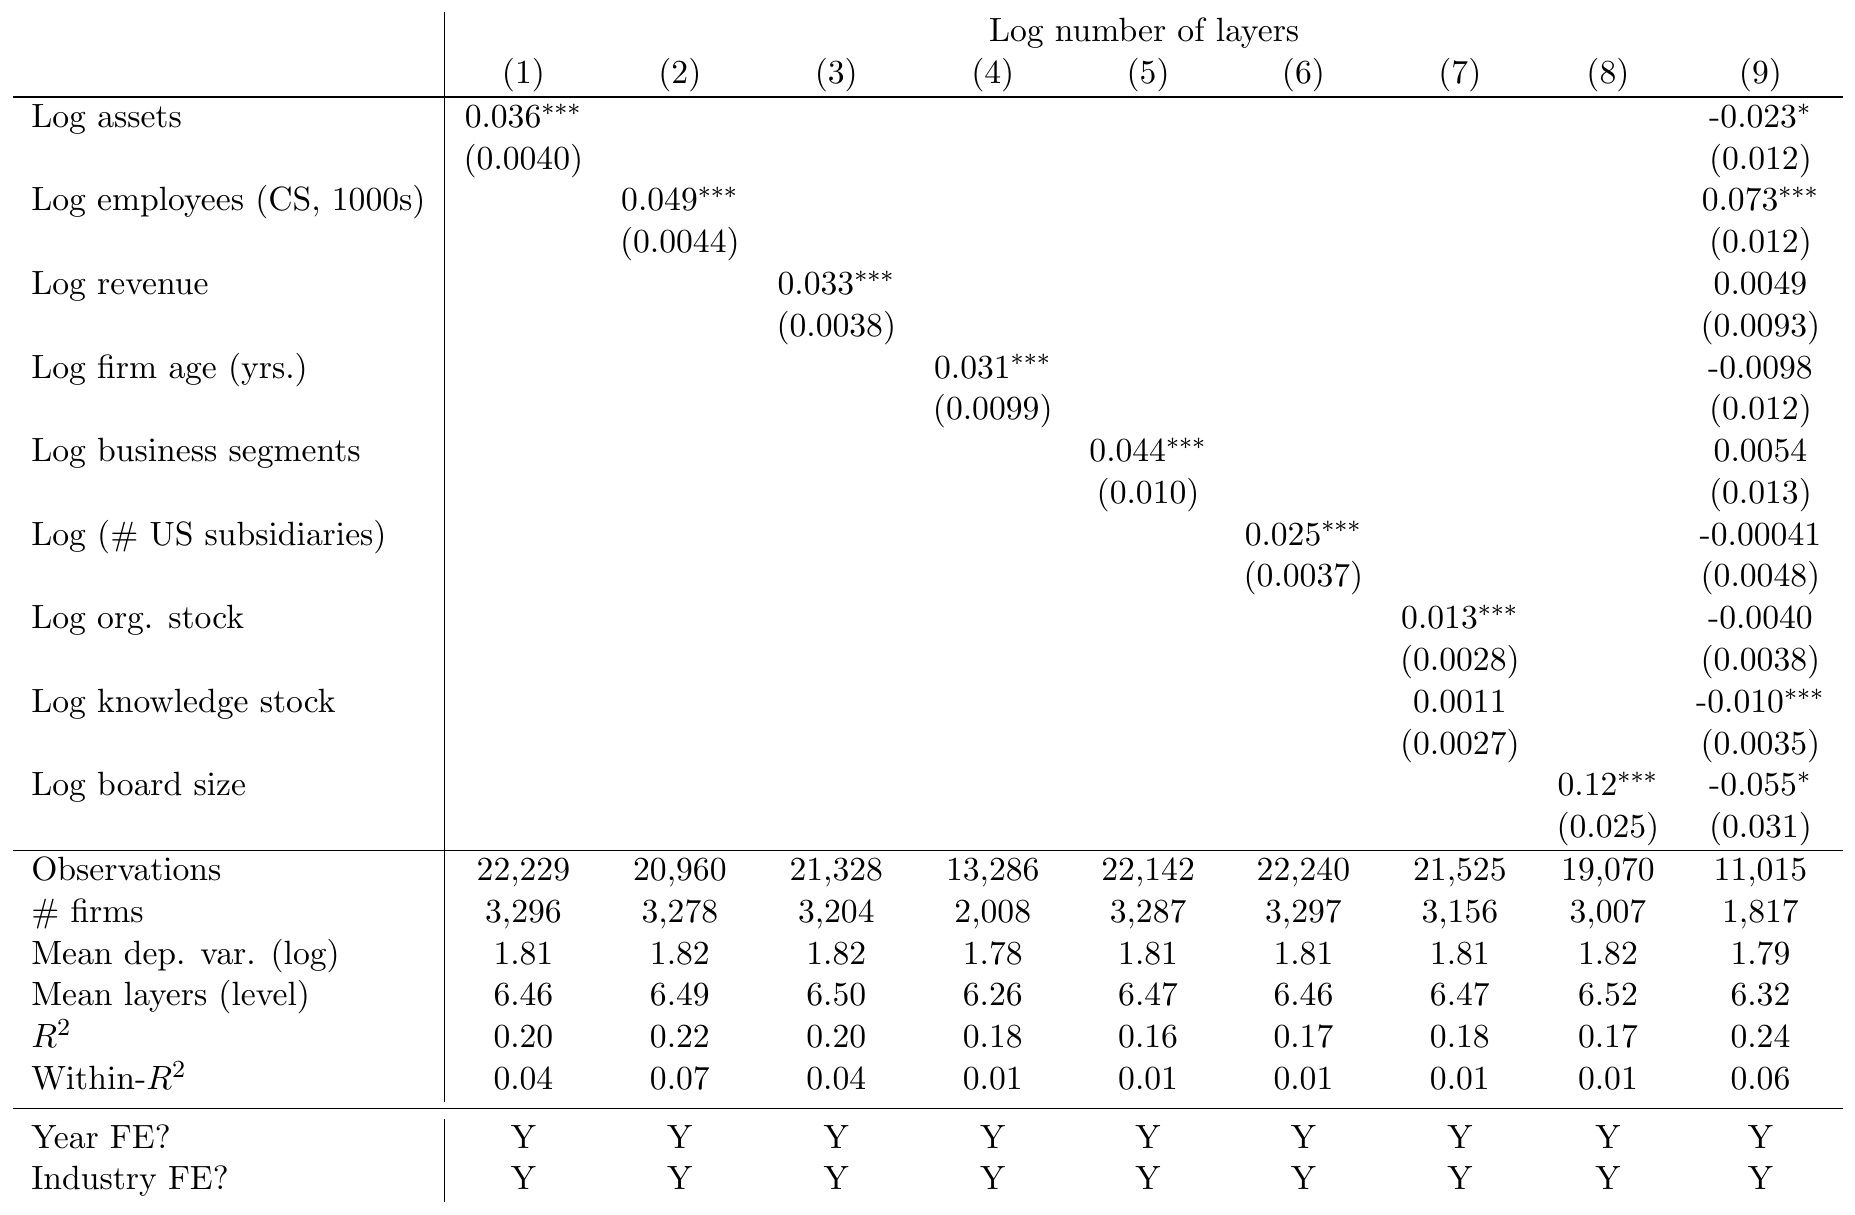
  • strongly correlates with firm size
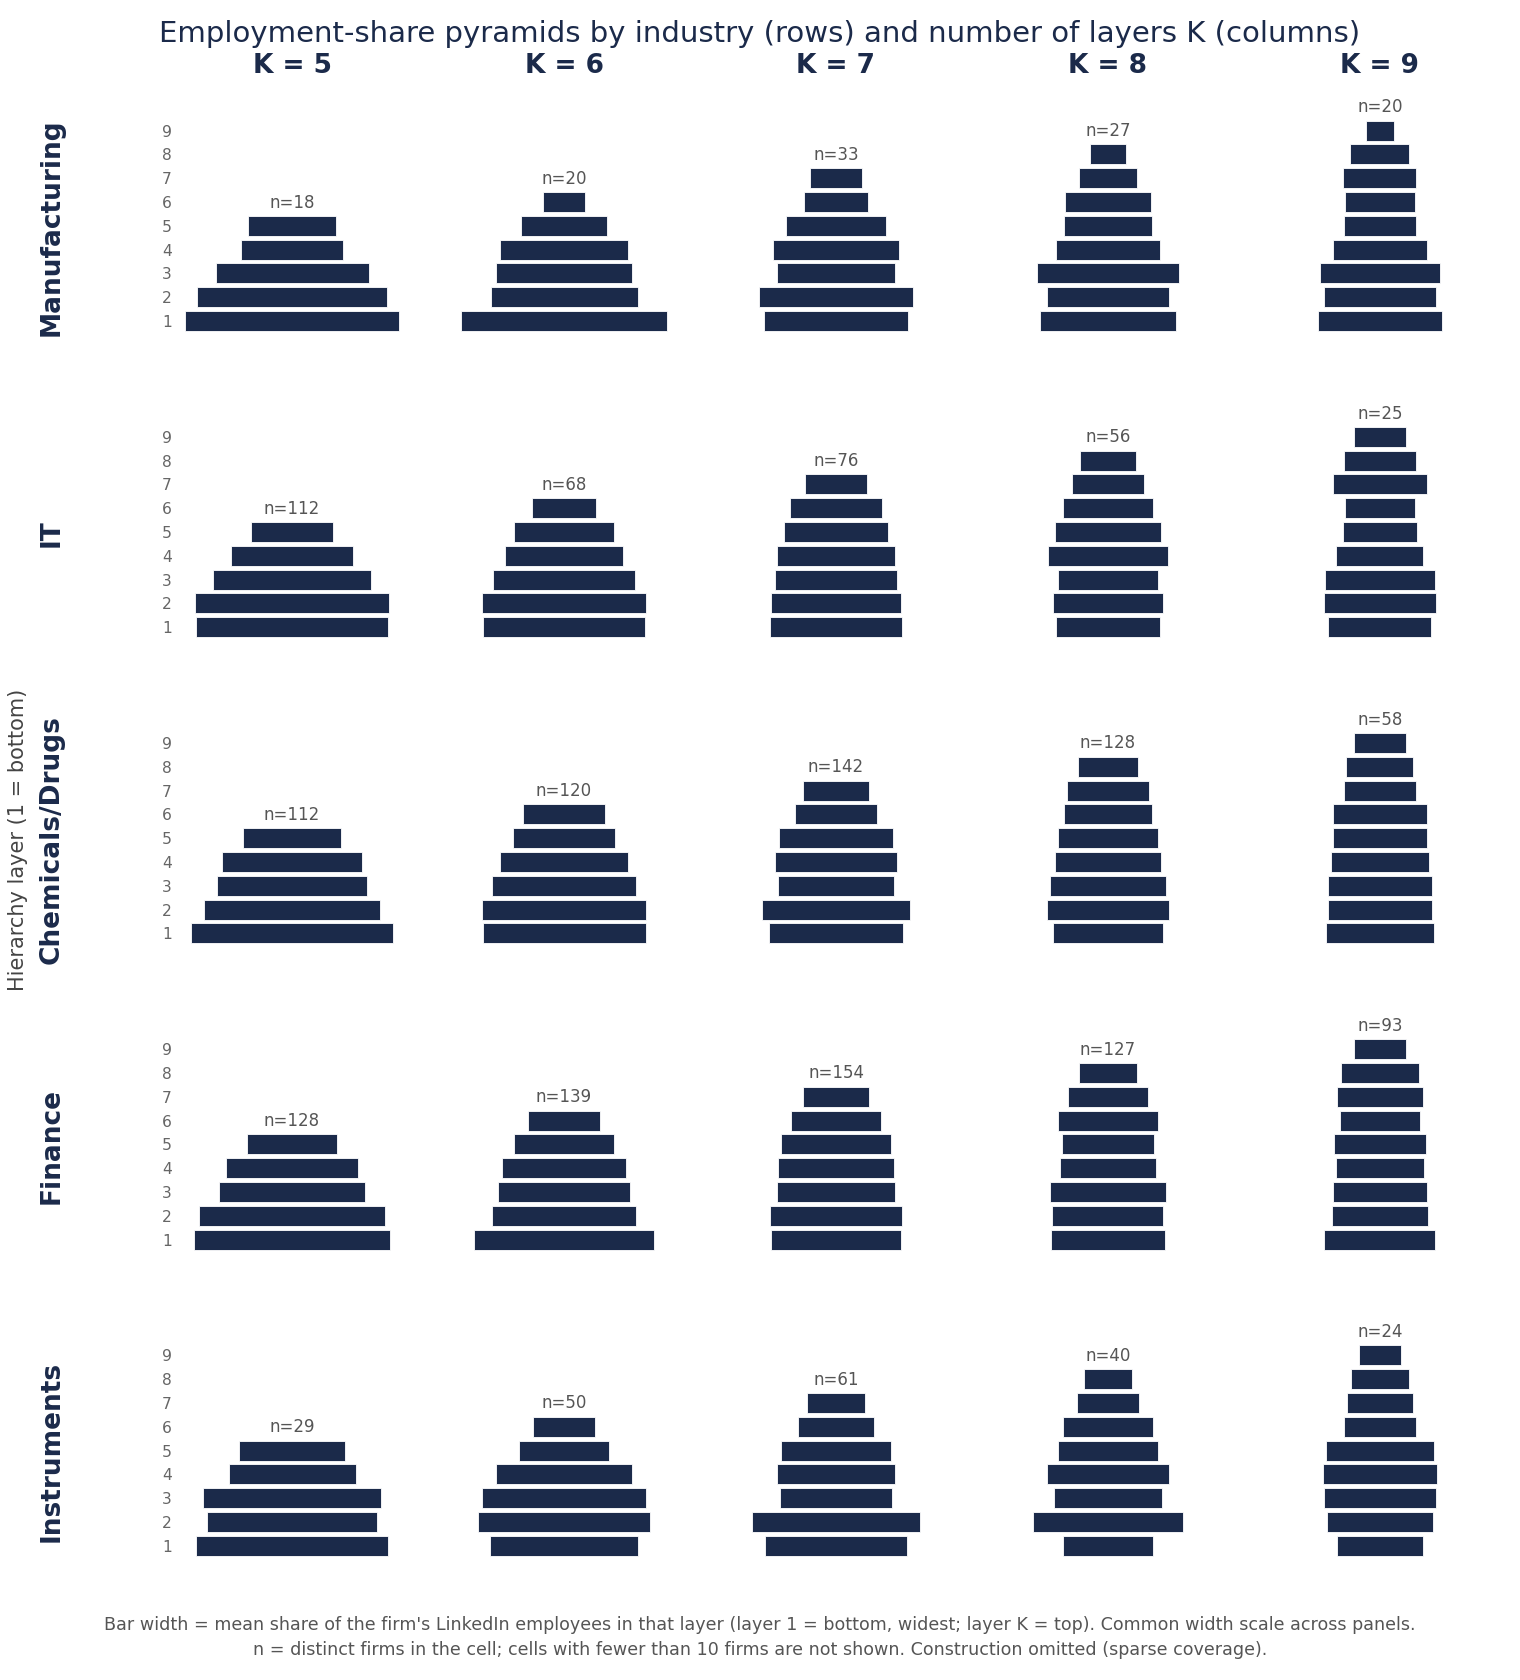
  • firms should be (roughly) pyramidal in shape
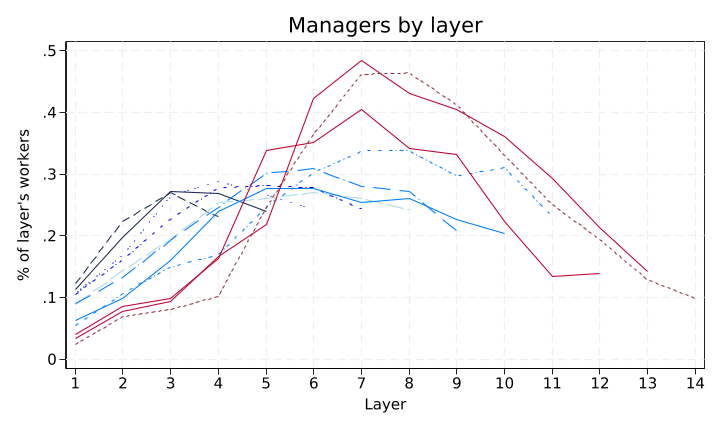
  • where there are layers, there should be managers
Columbia Business School
Corporate Hierarchy

Titles by layer match expectations
Columbia Business School
Corporate Hierarchy

Worker experience in higher layers

  • The clustering algorithm sorts workers by experience level (since first job or BA)
Columbia Business School
Corporate Hierarchy

Firm size predicts layers
Columbia Business School
Corporate Hierarchy

Typical firm has a pyramidal shape
Columbia Business School
Corporate Hierarchy

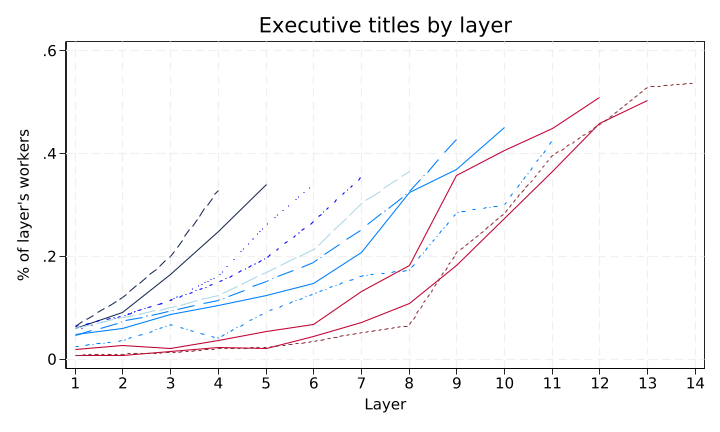
Managers and executives by layer
Columbia Business School
Corporate Hierarchy

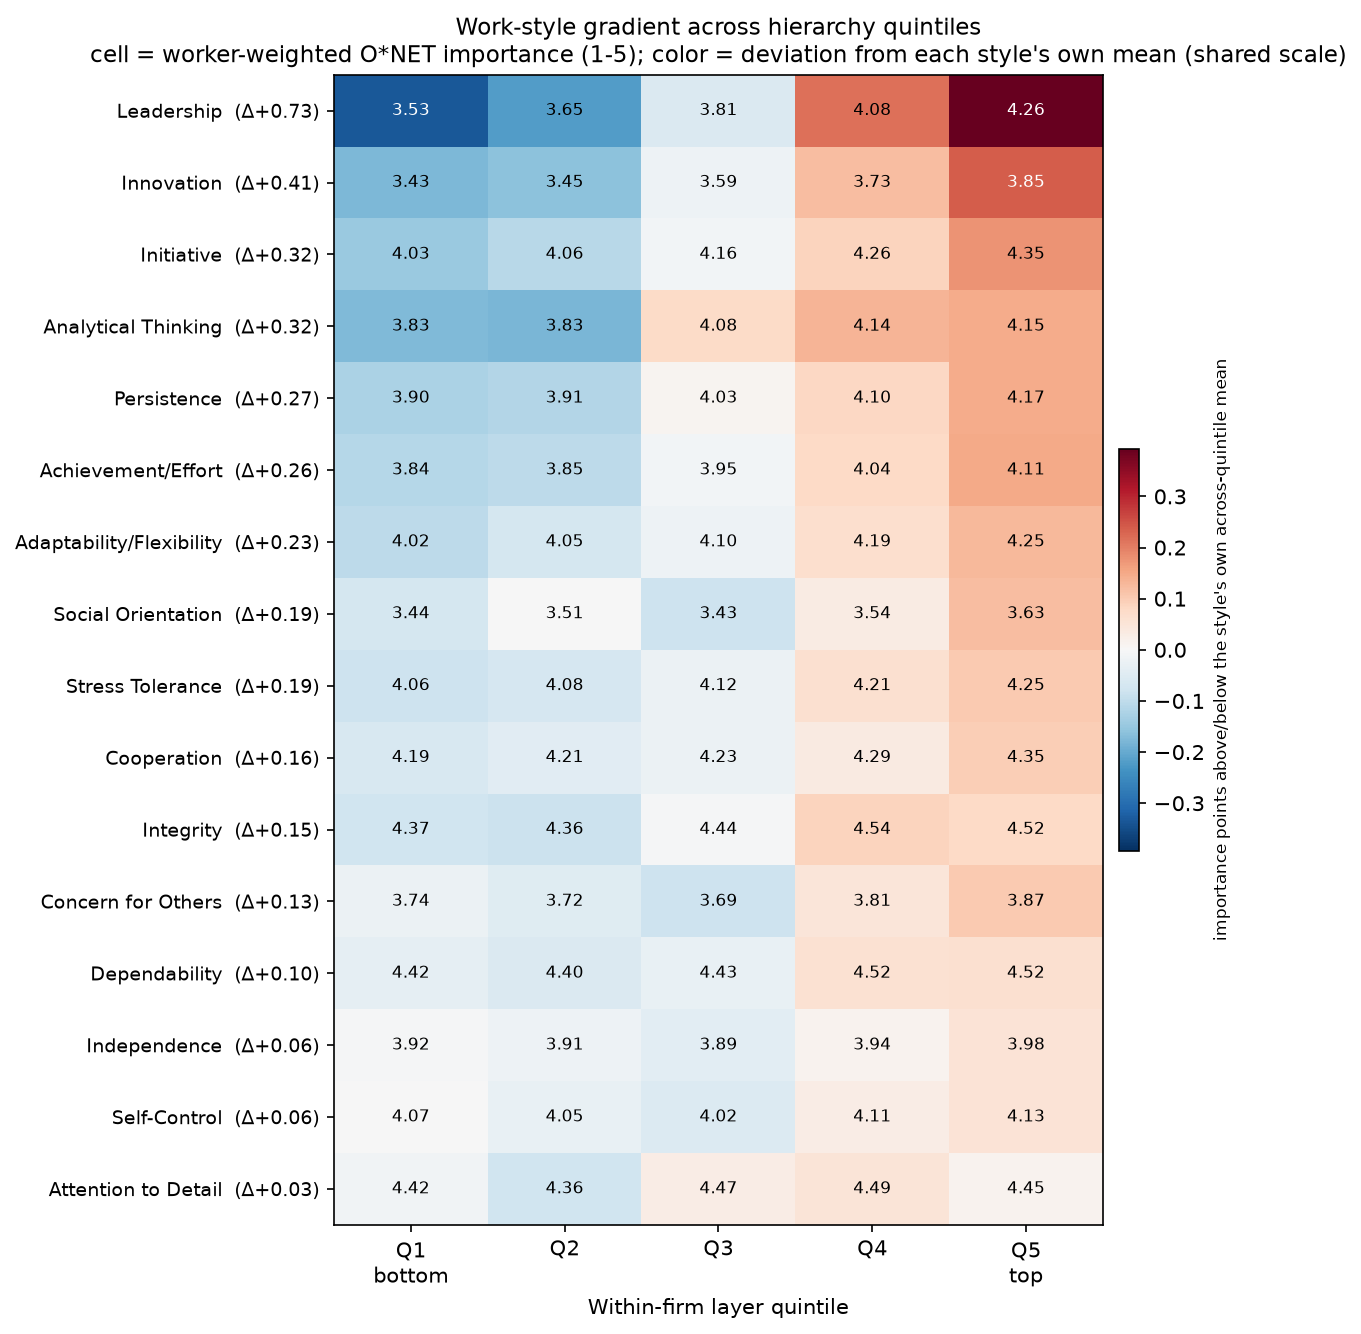
External gradients: wages, work styles, skill

  • BLS wages: top rank quintile pays about twice the bottom
  • O*NET work styles: leadership, innovation, initiative rise up the hierarchy
  • O*NET Job Zone: top quintile sits more than a full zone above the bottom
Columbia Business School
Corporate Hierarchy

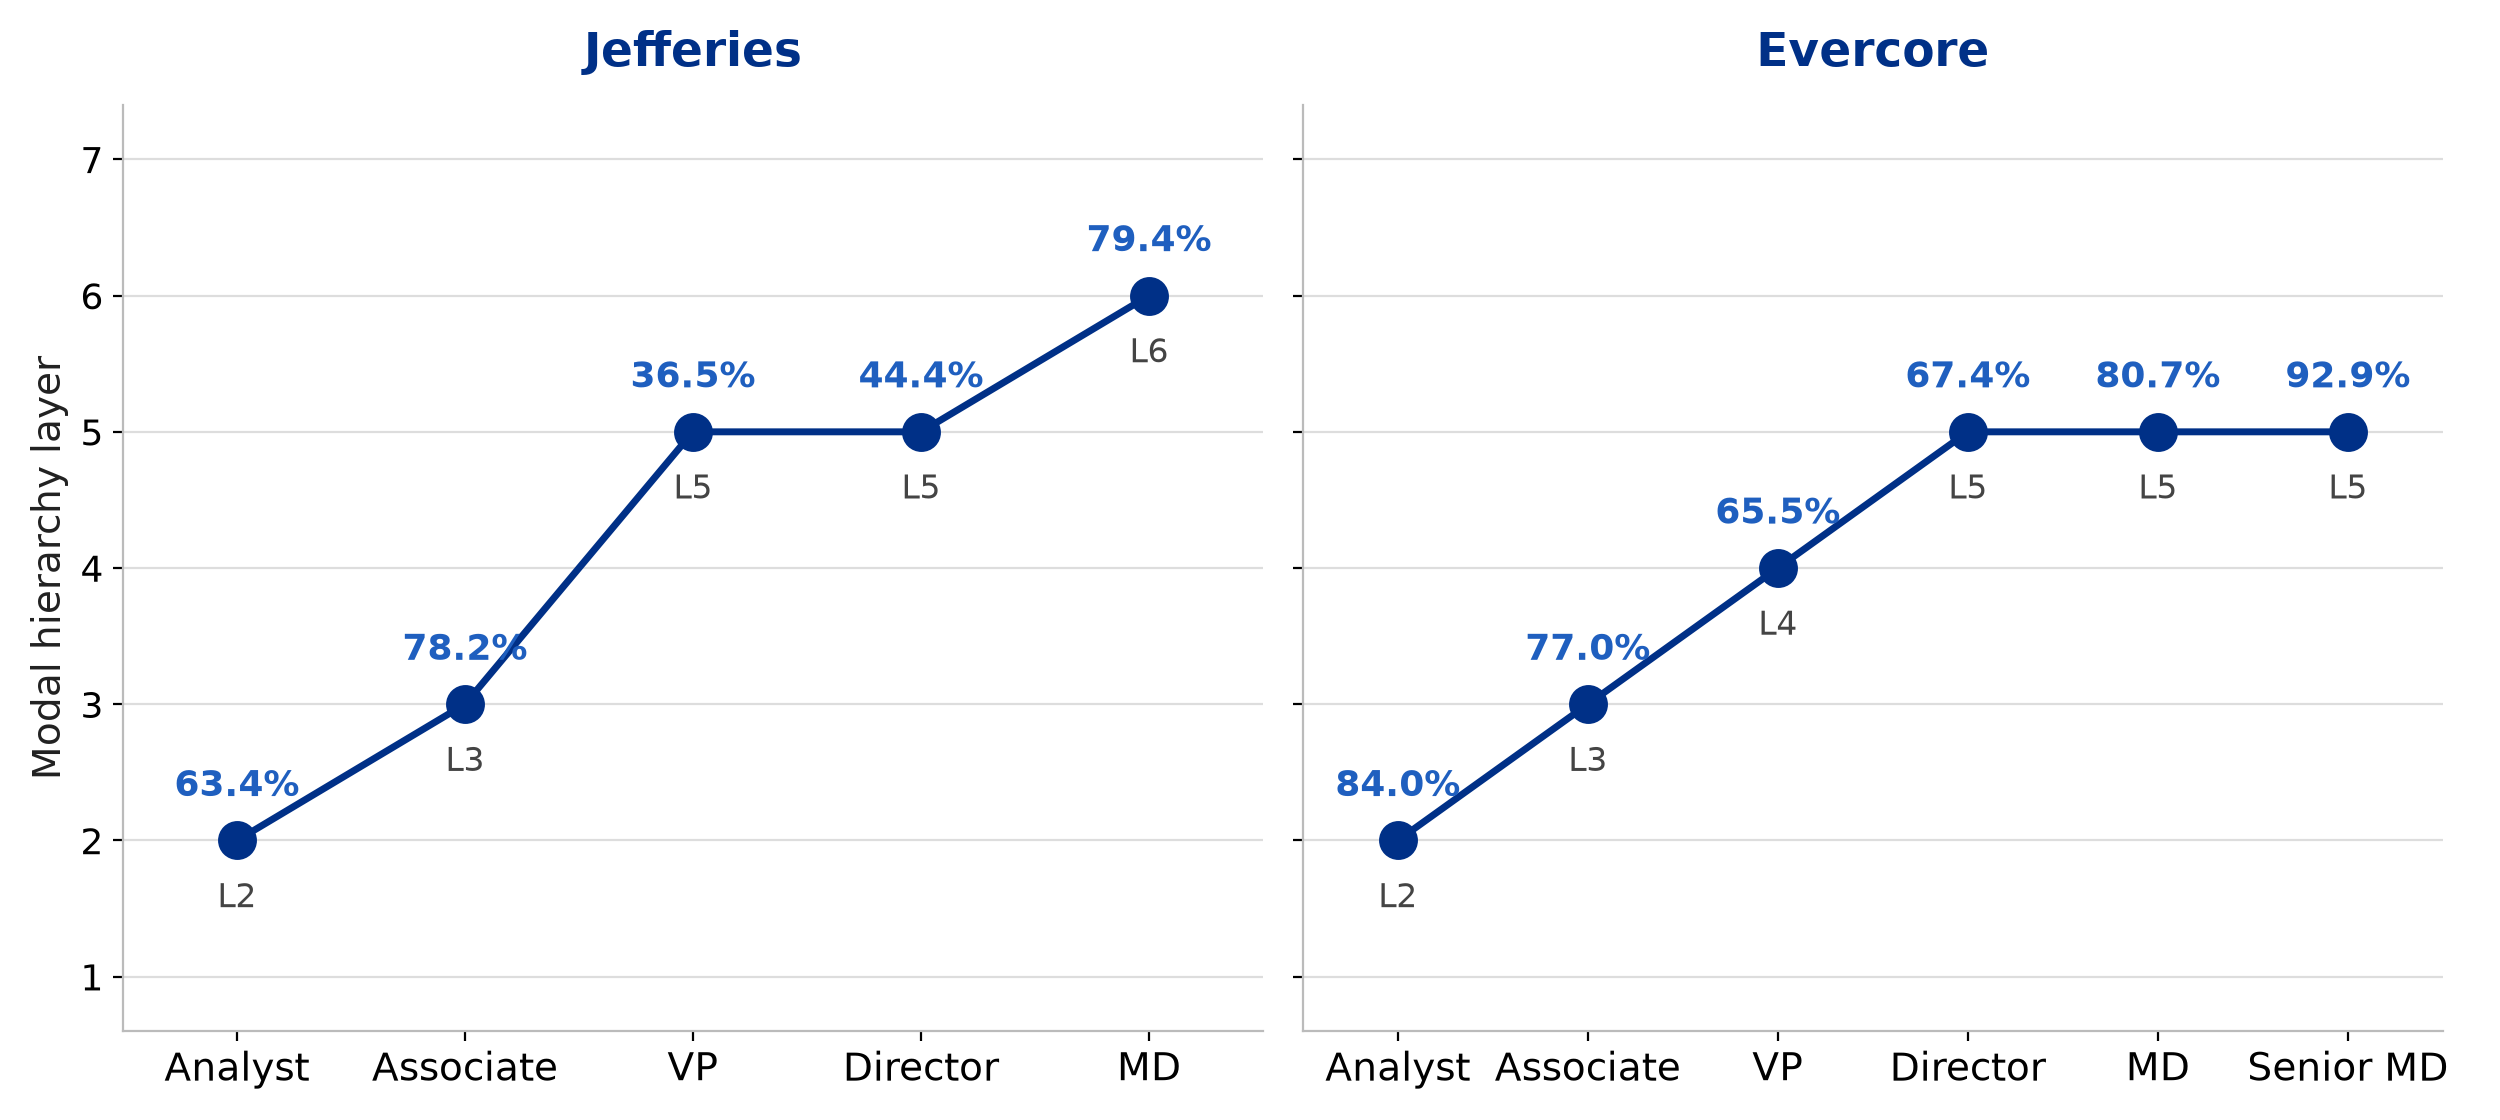
Known job ladders: investment banks

  • Jefferies: 7 layers; analyst → associate → VP → MD land on rising layers (modal layers 2/3/5/6)
  • Evercore: 7 layers; same weakly increasing ladder (2/3/4/5)
  • Lazard not in sample
Columbia Business School
Corporate Hierarchy

Summary of validations

  • intuitive titles and roles in hierarchical layers
  • higher layers → more experience
  • strongly correlates with firm size
  • firms should be (roughly) pyramidal in shape
  • where there are layers, there should be managers

We are confident that this data-driven measure captures the basic feature of a quality hierarchy measure.

Columbia Business School
Corporate Hierarchy
Outcomes
Does hierarchy predict firm decisions and outcomes?
What follows is not identified
Motivation
Theory
Measurement
Data and representativeness
Validation
Outcomes
What explains layers
Conclusion
Columbia Business School
Corporate Hierarchy

Questions we ask

  • Does going public correlate with changing layers?
  • Are more hierarchical firm’s human capital different?
  • Does hierarchy correlate with firm productivity and costs?
  • Can we explain firm investment in innovation and acquisitions?
  • Do stock volatility and stock returns depend on layers?
Columbia Business School
Corporate Hierarchy

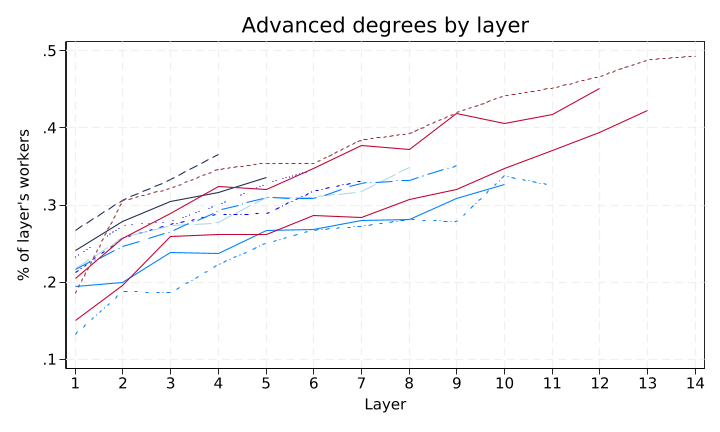
Human capital: education

  • High-layer firms naturally have more promotion opportunities; theory predicts wage increases with layer
Columbia Business School
Corporate Hierarchy

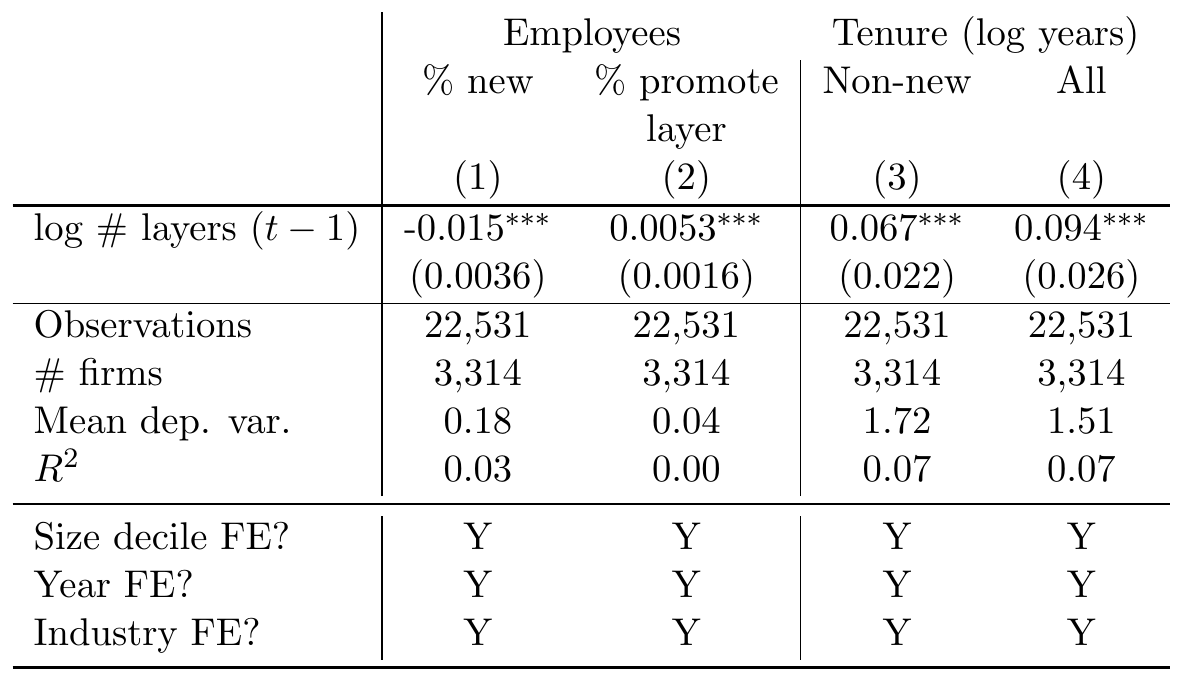
Human capital: tenure and turnover

  • Fewer new hires (−0.015***), more layer promotions (0.0053***), longer tenure (0.067***/0.094***)
Columbia Business School
Corporate Hierarchy

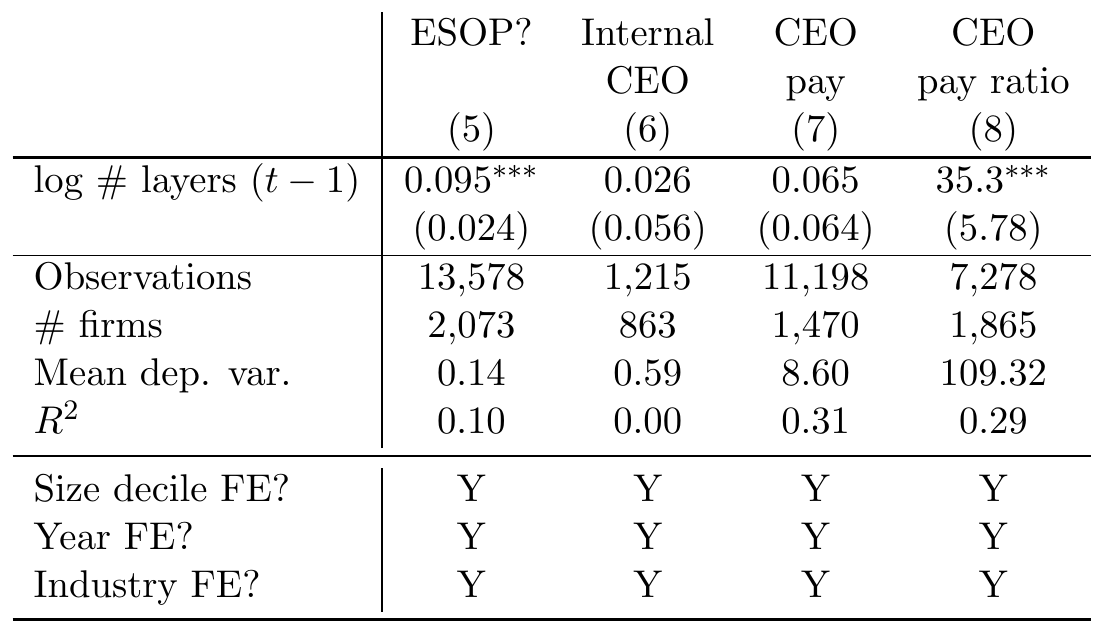
Employee equity and the CEO

  • ESOP more likely (0.095***); CEO pay ratio higher (35.3***)
  • Internal CEO: positive but not significant
Columbia Business School
Corporate Hierarchy

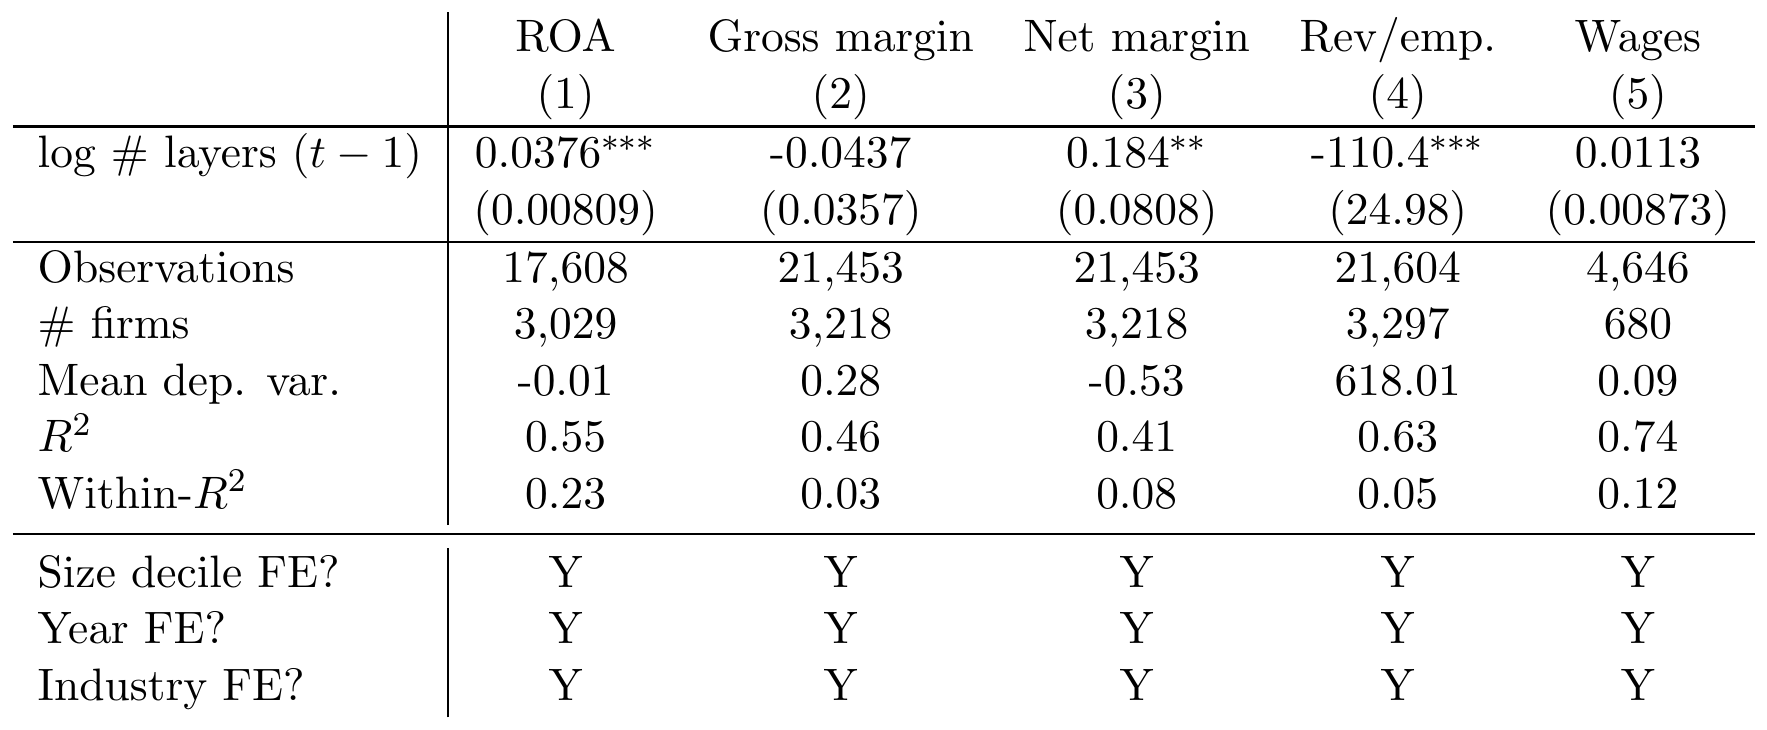
Productivity and costs

  • Benefits: ROA 0.0376***, net margin 0.184** (gross margin n.s.)
  • Costs: revenue per employee −110.4*** (“more managers not directly involved in production”); wages positive but n.s. (“more expensive human capital”, small Compustat wage sample)
Columbia Business School
Corporate Hierarchy

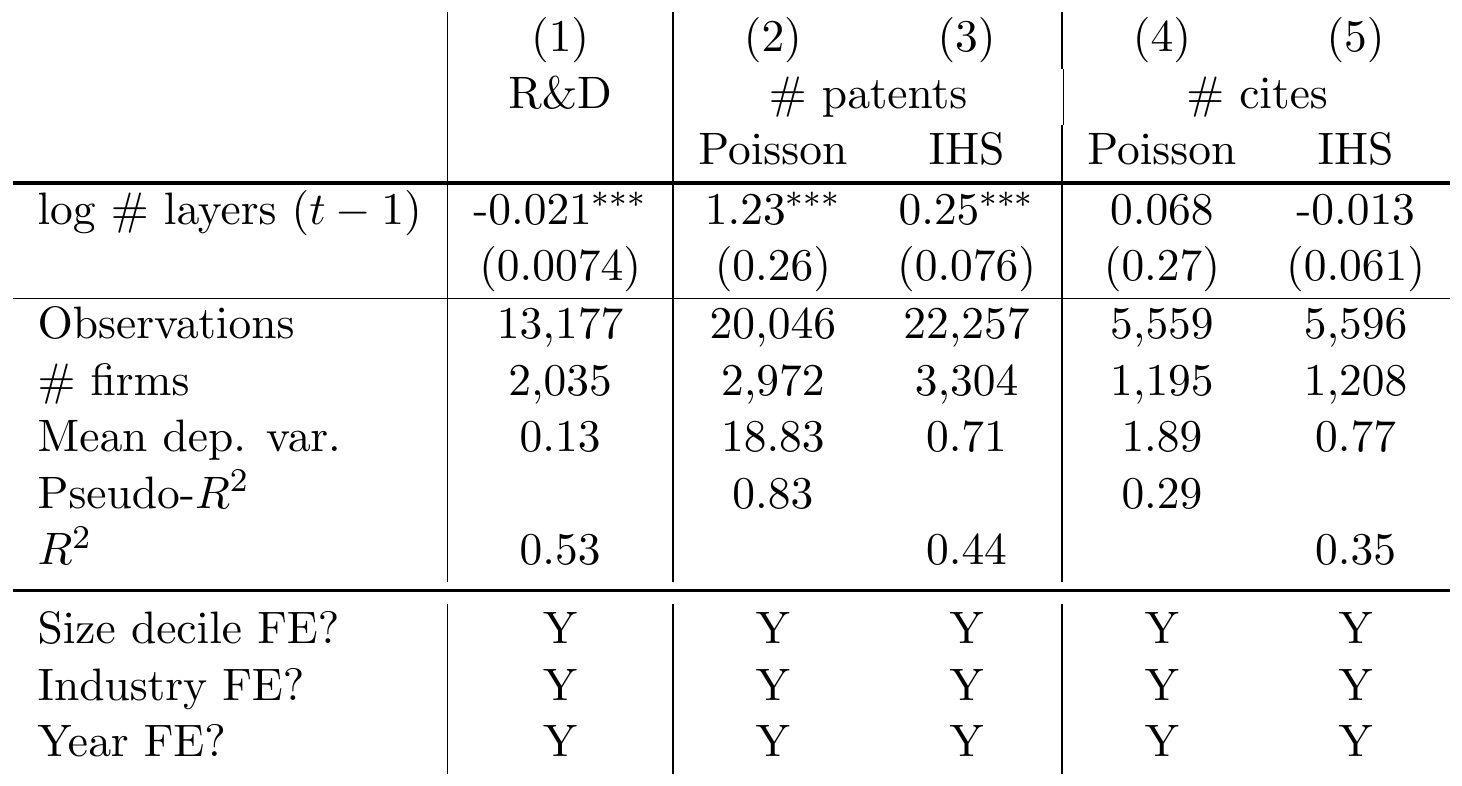
Innovation: less R&D, more patents, same quality

  • R&D/assets −0.021***; # patents Poisson +1.23***, IHS +0.25***; citations n.s.
Columbia Business School
Corporate Hierarchy

Hierarchy and firm risk

  • A firm’s decision to add or remove management layers – problem solvers – could impact its ability to take and bear risk.
  • Caliendo et al. (2020): demand shocks increase layers, improving productivity
    • → firms with more layers have the structure to respond to shocks in the cross-sections.
  • Garicano (2000): lower predictability in the production process leads firms to add more layers weakly (never remove)
    • → firms with more layers can adjust to unexpected shocks.
Columbia Business School
Corporate Hierarchy

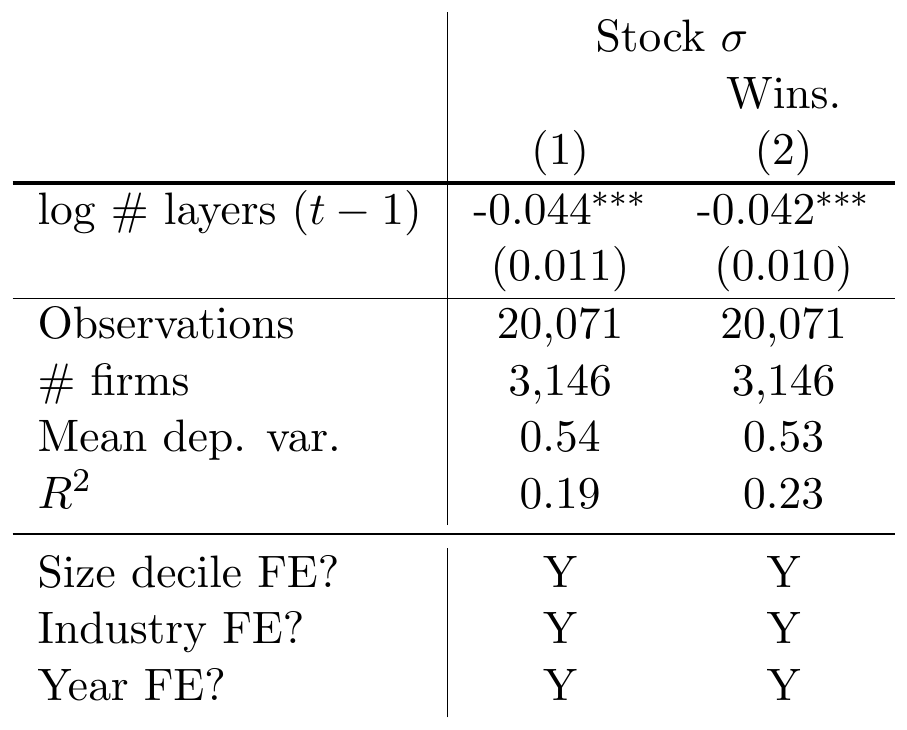
More layers, lower stock volatility

  • −0.044*** / −0.042*** (raw / winsorized); N 20,071; 3,146 firms
  • About 3% lower volatility for a 1 s.d. increase in log layers
Columbia Business School
Corporate Hierarchy

Business or financial risk?

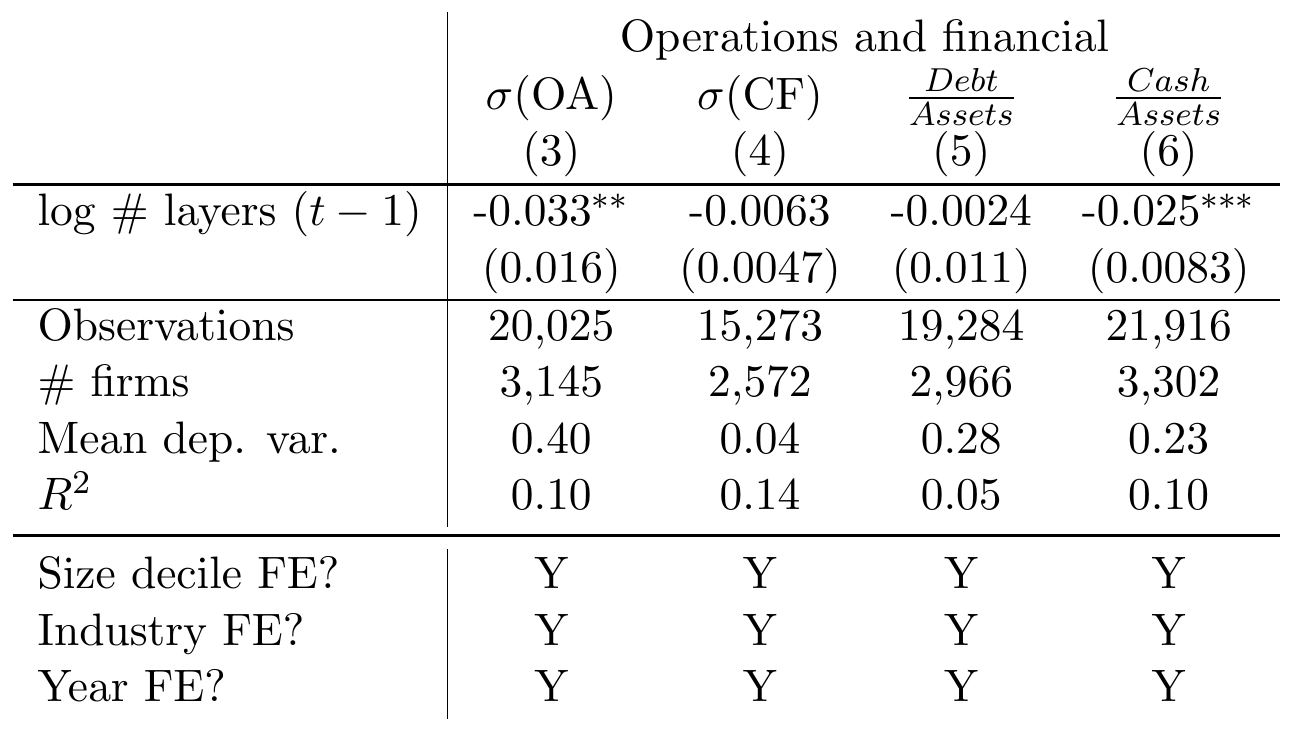
  • Lower operating-asset volatility (−0.033**); cash-flow vol n.s.; debt n.s.; less cash (−0.025***)
Columbia Business School
Corporate Hierarchy

Hierarchy-sorted portfolio returns

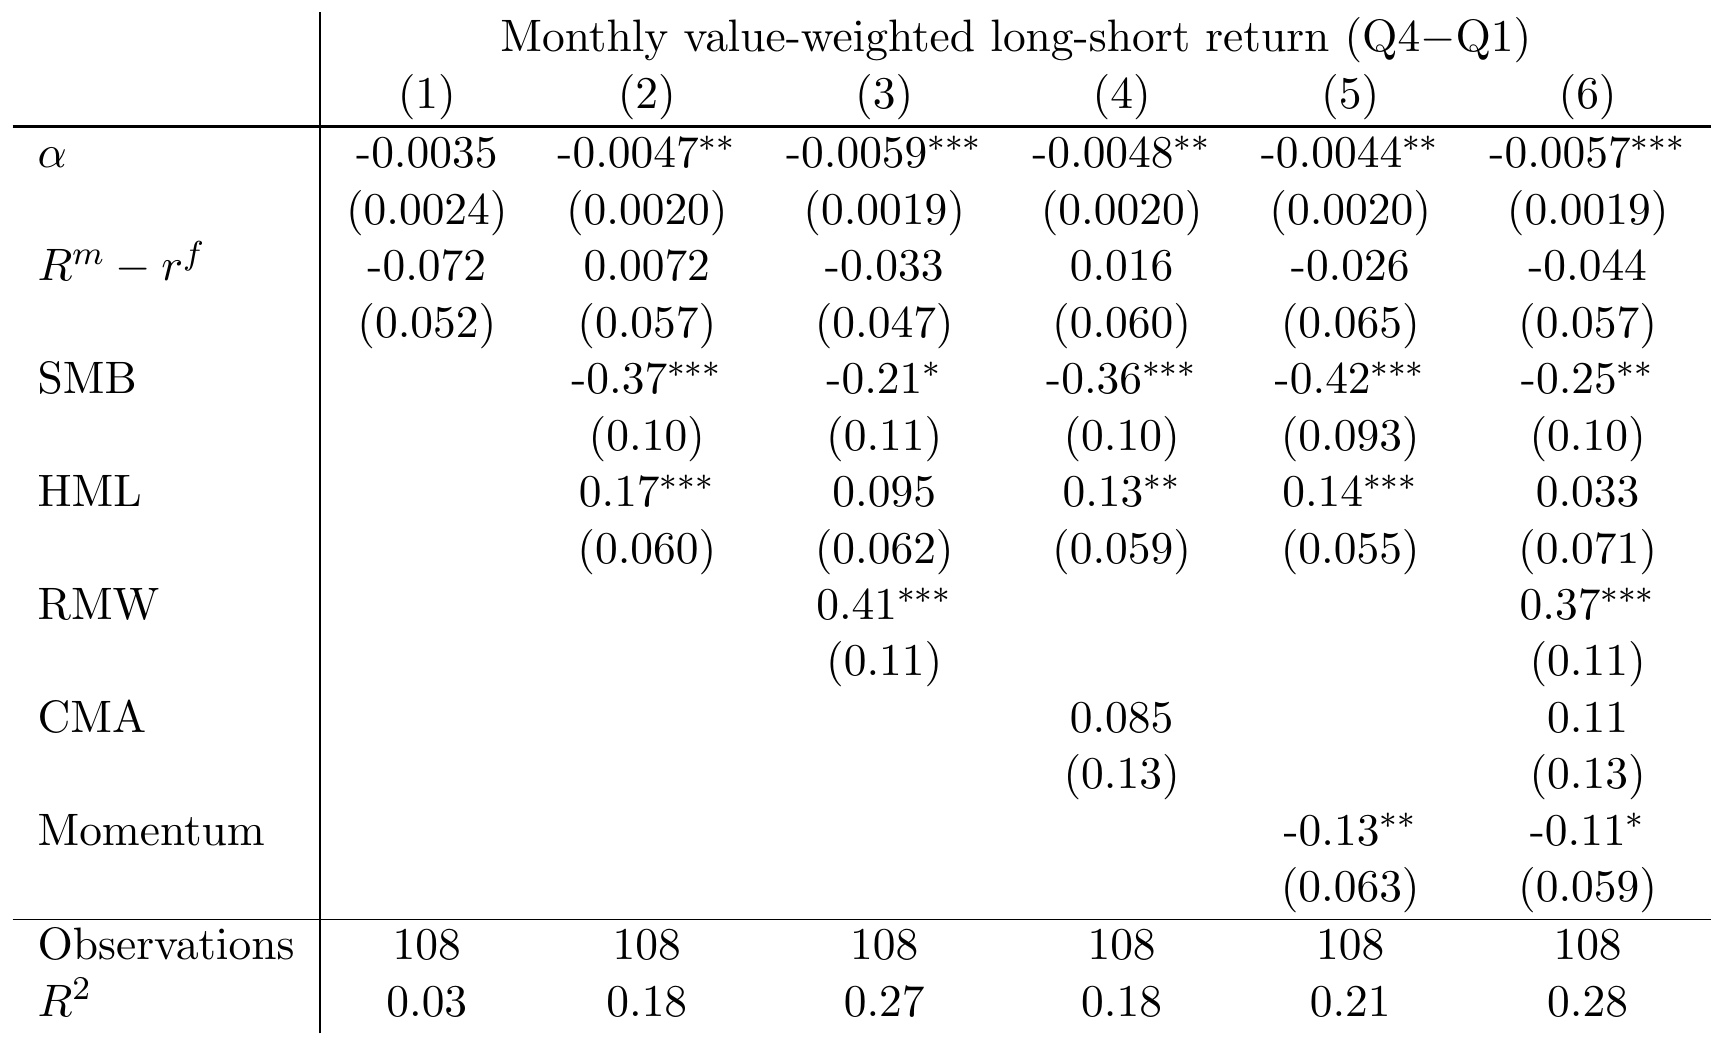
  • Each year sort firms into quartiles of lagged log layers; long top quartile, short bottom; value-weighted; 2016 to 2024 (108 months)
  • Negative alphas regardless of the asset pricing model (CAPM through the 6-factor model); statistically significant in 5 of 6 specifications
Columbia Business School
Corporate Hierarchy

Interpreting the negative alphas

  • Explanation 1: investors overestimate high-layer firms’ future performance. Little support: IBES analyst EPS forecasts show no systematic over- or underestimation of high- vs. low-layer firms
  • Explanation 2 (suggestive): layers may capture a priced risk factor the models miss. High-layer firms are significantly less risky across several metrics; low-layer firms may carry an “organizational risk” premium
  • Factor loadings agree: profitability (RMW) loads positively, size (SMB) negatively; high-layer stocks look like large-cap quality firms
Columbia Business School
Corporate Hierarchy

Putting it altogether

  • Tradeoffs of a more hierarchical structure; theory only partial guidance
  • Prior measures impose a common 4 to 8 layer grid on every firm
  • Firm-specific measure: middle half of firms 5 to 8 layers in 2024; 18% outside the 4 to 8 band; up to 18 layers
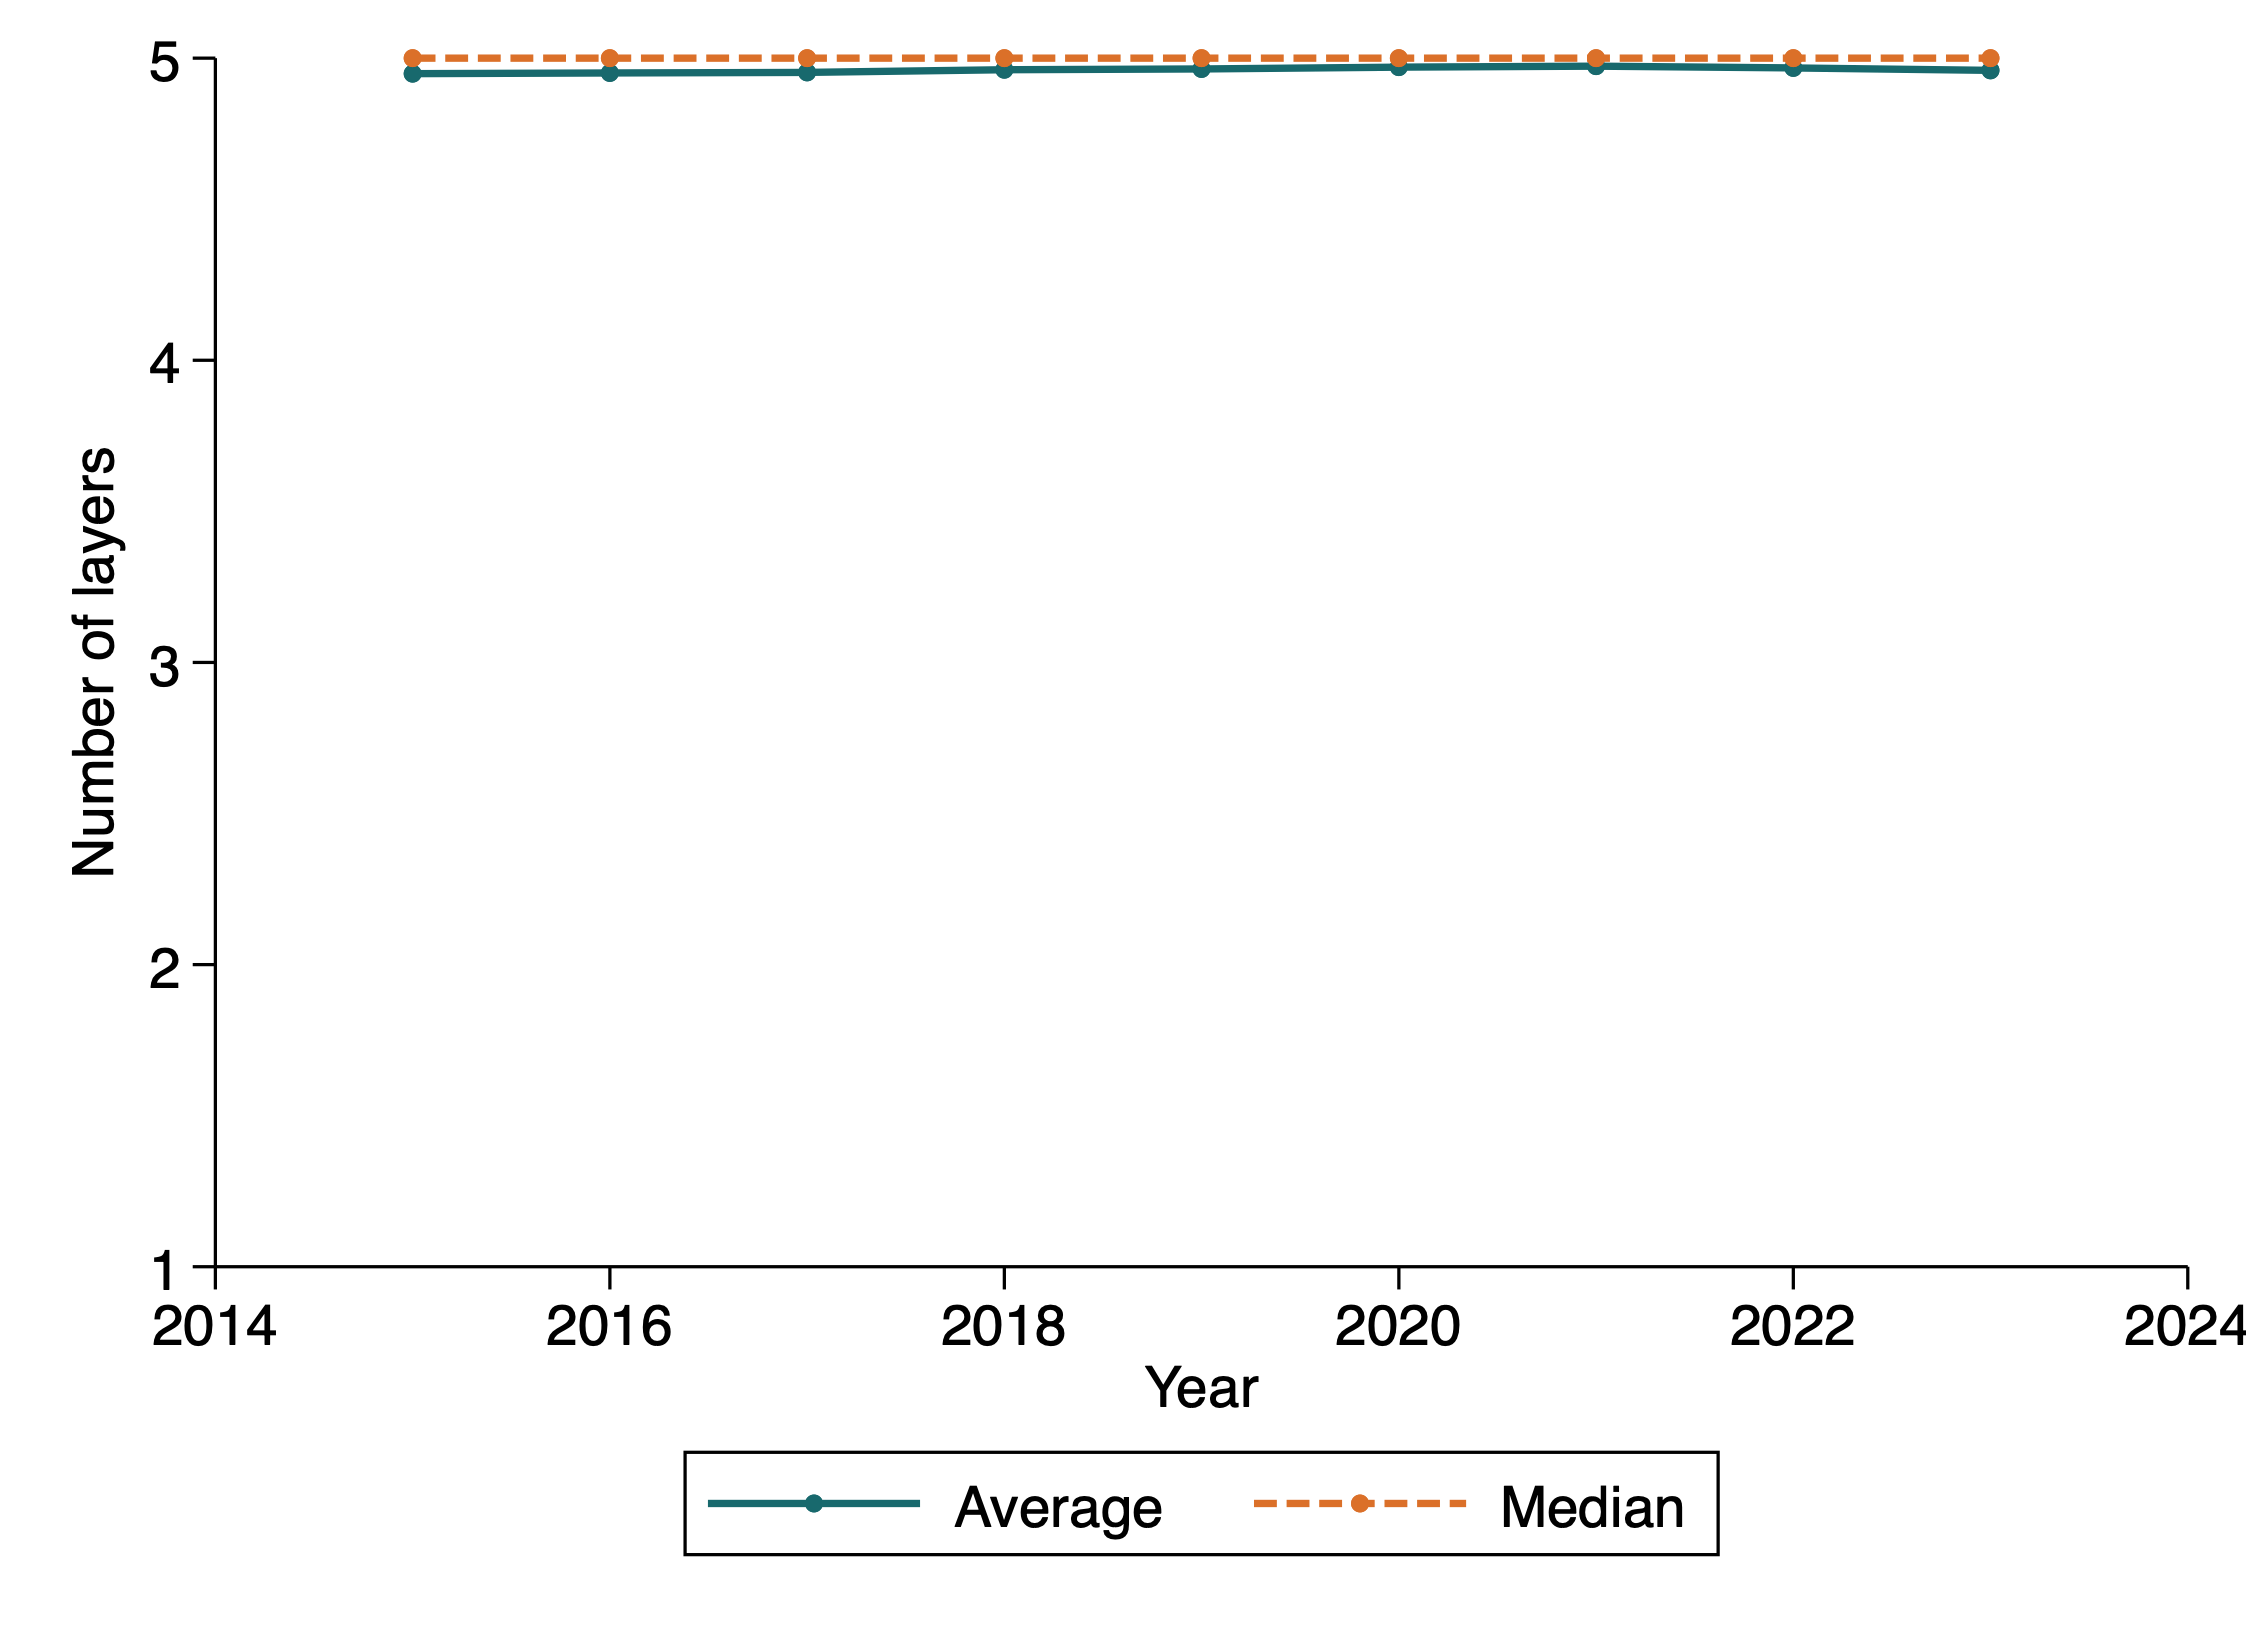
  • O*NET Job Zone clustering: every public firm 5 layers, no variation
Columbia Business School
Corporate Hierarchy
What explains layers
Moving hierarchy to the left-hand side
Motivation
Theory
Measurement
Data and representativeness
Validation
Outcomes
What explains layers
Conclusion
Columbia Business School
Corporate Hierarchy

Layers are an investment

We have thus far taken layers as given, correlating with firm observables

  • Theory has a lot to say about how firms choose their hierarchy

Consider two explanations:

  1. Positive demand or “complexity” shocks → more layers
  2. Improvements in knowledge acquisition → fewer layers
Columbia Business School
Corporate Hierarchy

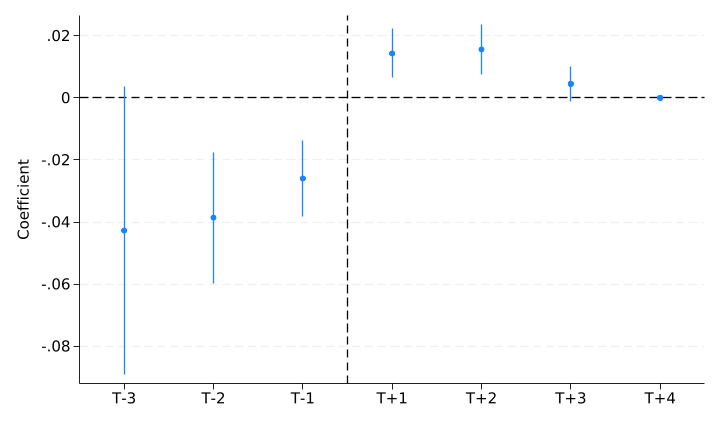
Going public: more layers after the IPO

  • Bernstein (2012); Bias et al. (JF 2026) German hierarchization
Columbia Business School
Corporate Hierarchy

AI: cheaper knowledge acquisition

  • Key prediction from Garicano (2000): lower the cost of knowledge acquisition – incorporating information and solving problems – lowers the need for layers
  • Lower layer workers can solve more problems themselves
  • Babina et al. (2024): identify when firms first post jobs for AI positions = proxy for AI adoption
Columbia Business School
Corporate Hierarchy

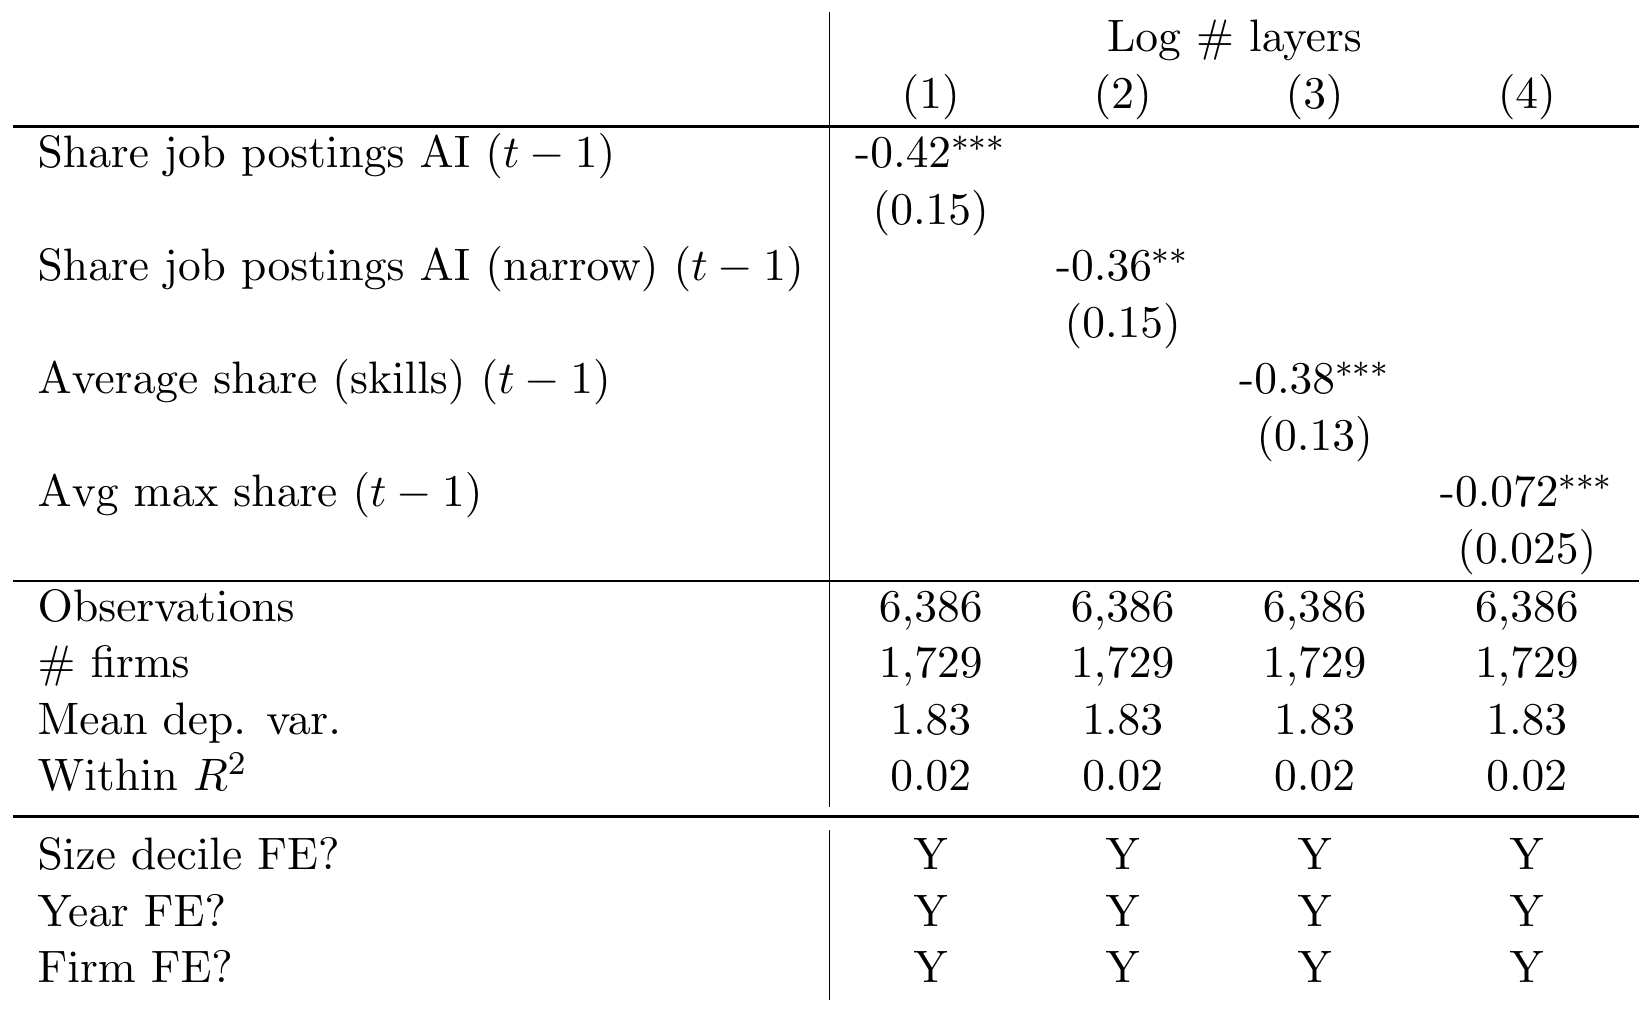
Introduction of AI: fewer layers within firm

  • Garicano (2000): cheaper knowledge acquisition lowers the need for layers
  • Babina et al. (2024) measures; all four AI proxies negative (−0.42*** … −0.072***); firm FE; N 6,386
Columbia Business School
Corporate Hierarchy
Conclusion
Motivation
Theory
Measurement
Data and representativeness
Validation
Outcomes
What explains layers
Conclusion
Columbia Business School
Corporate Hierarchy

Hierarchies: measurable and important

  • Public workforce information reveals the firm’s hierarchy
  • Novel, data-driven measure for 3,454 US public firms
  • Benefits: workforce tied to the firm, operating performance, patent output, lower volatility
  • Costs: revenue per employee falls, with more managers not directly involved in production
Columbia Business School
Corporate Hierarchy

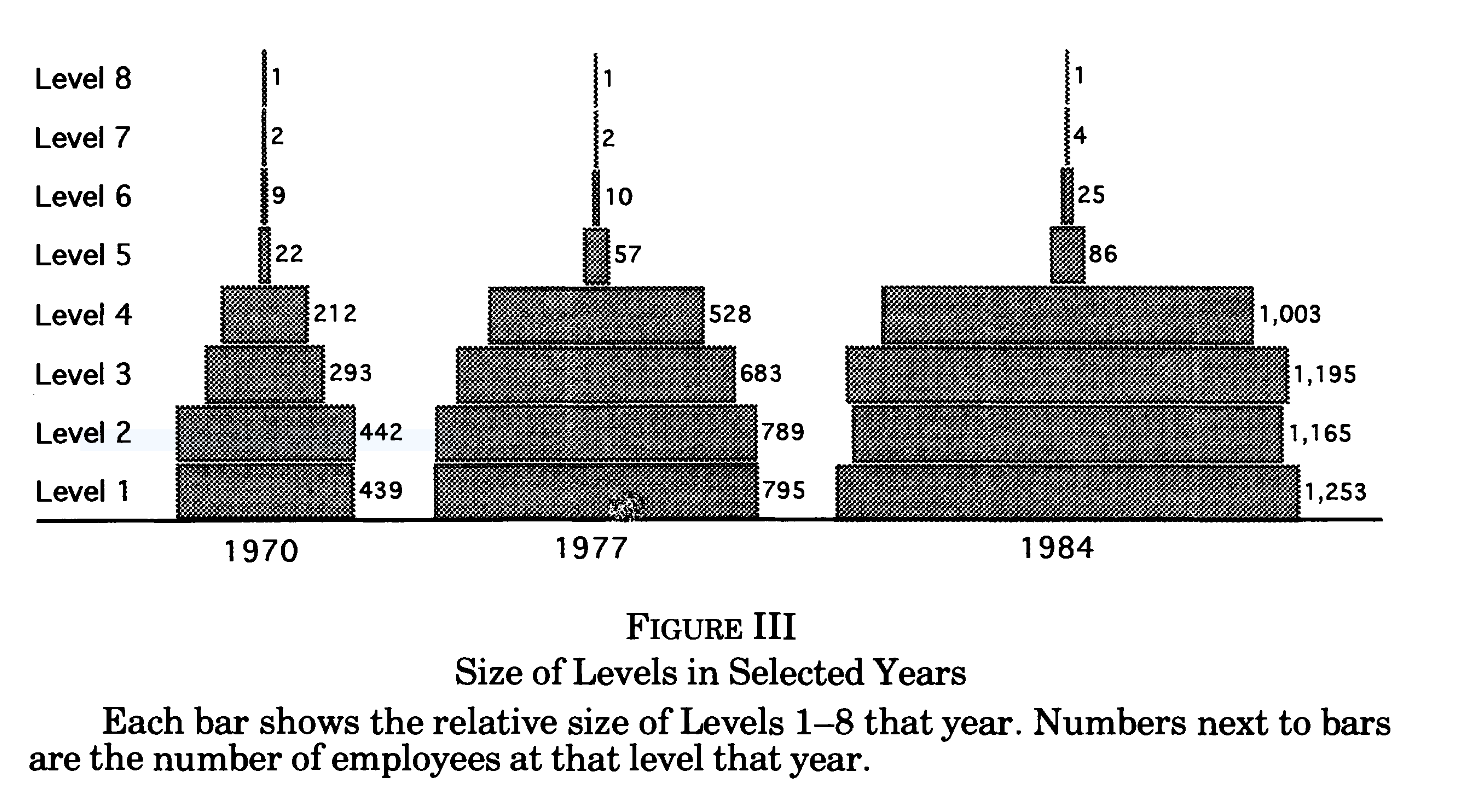
Baker et al.: from layers to firm shapes
Columbia Business School
Corporate Hierarchy

Simulator

[SCREENSHOT PENDING: static capture of hierarchy-coverage-sim.onrender.com]
Columbia Business School
Corporate Hierarchy

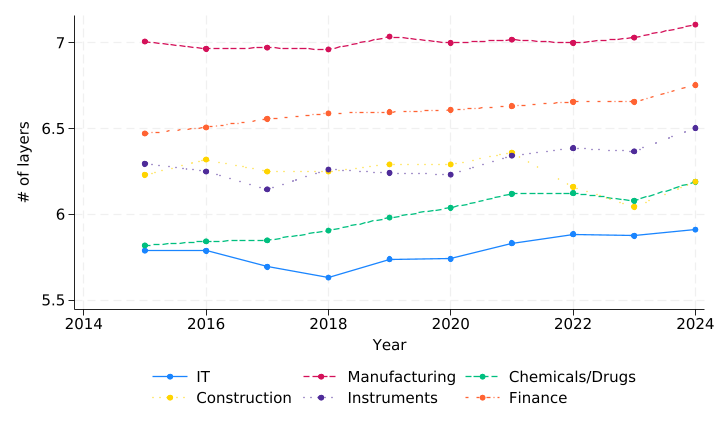
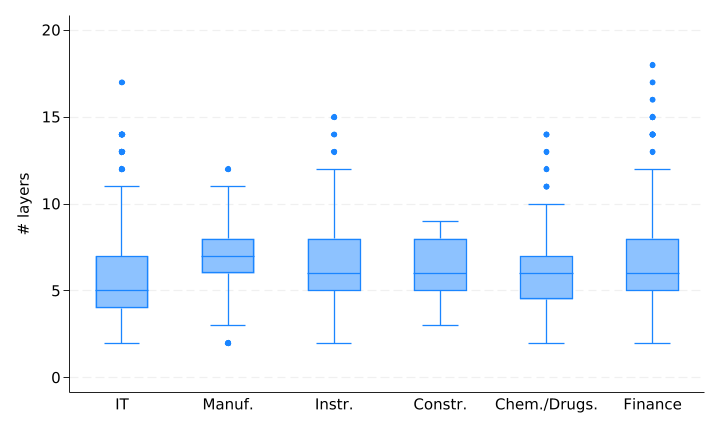
Industry variation of hierarchical layers

  • Few papers predict hierarchy differences by industry
  • Stein (2002): banks with more soft information should have fewer layers (“decentralized”)
Columbia Business School
Corporate Hierarchy

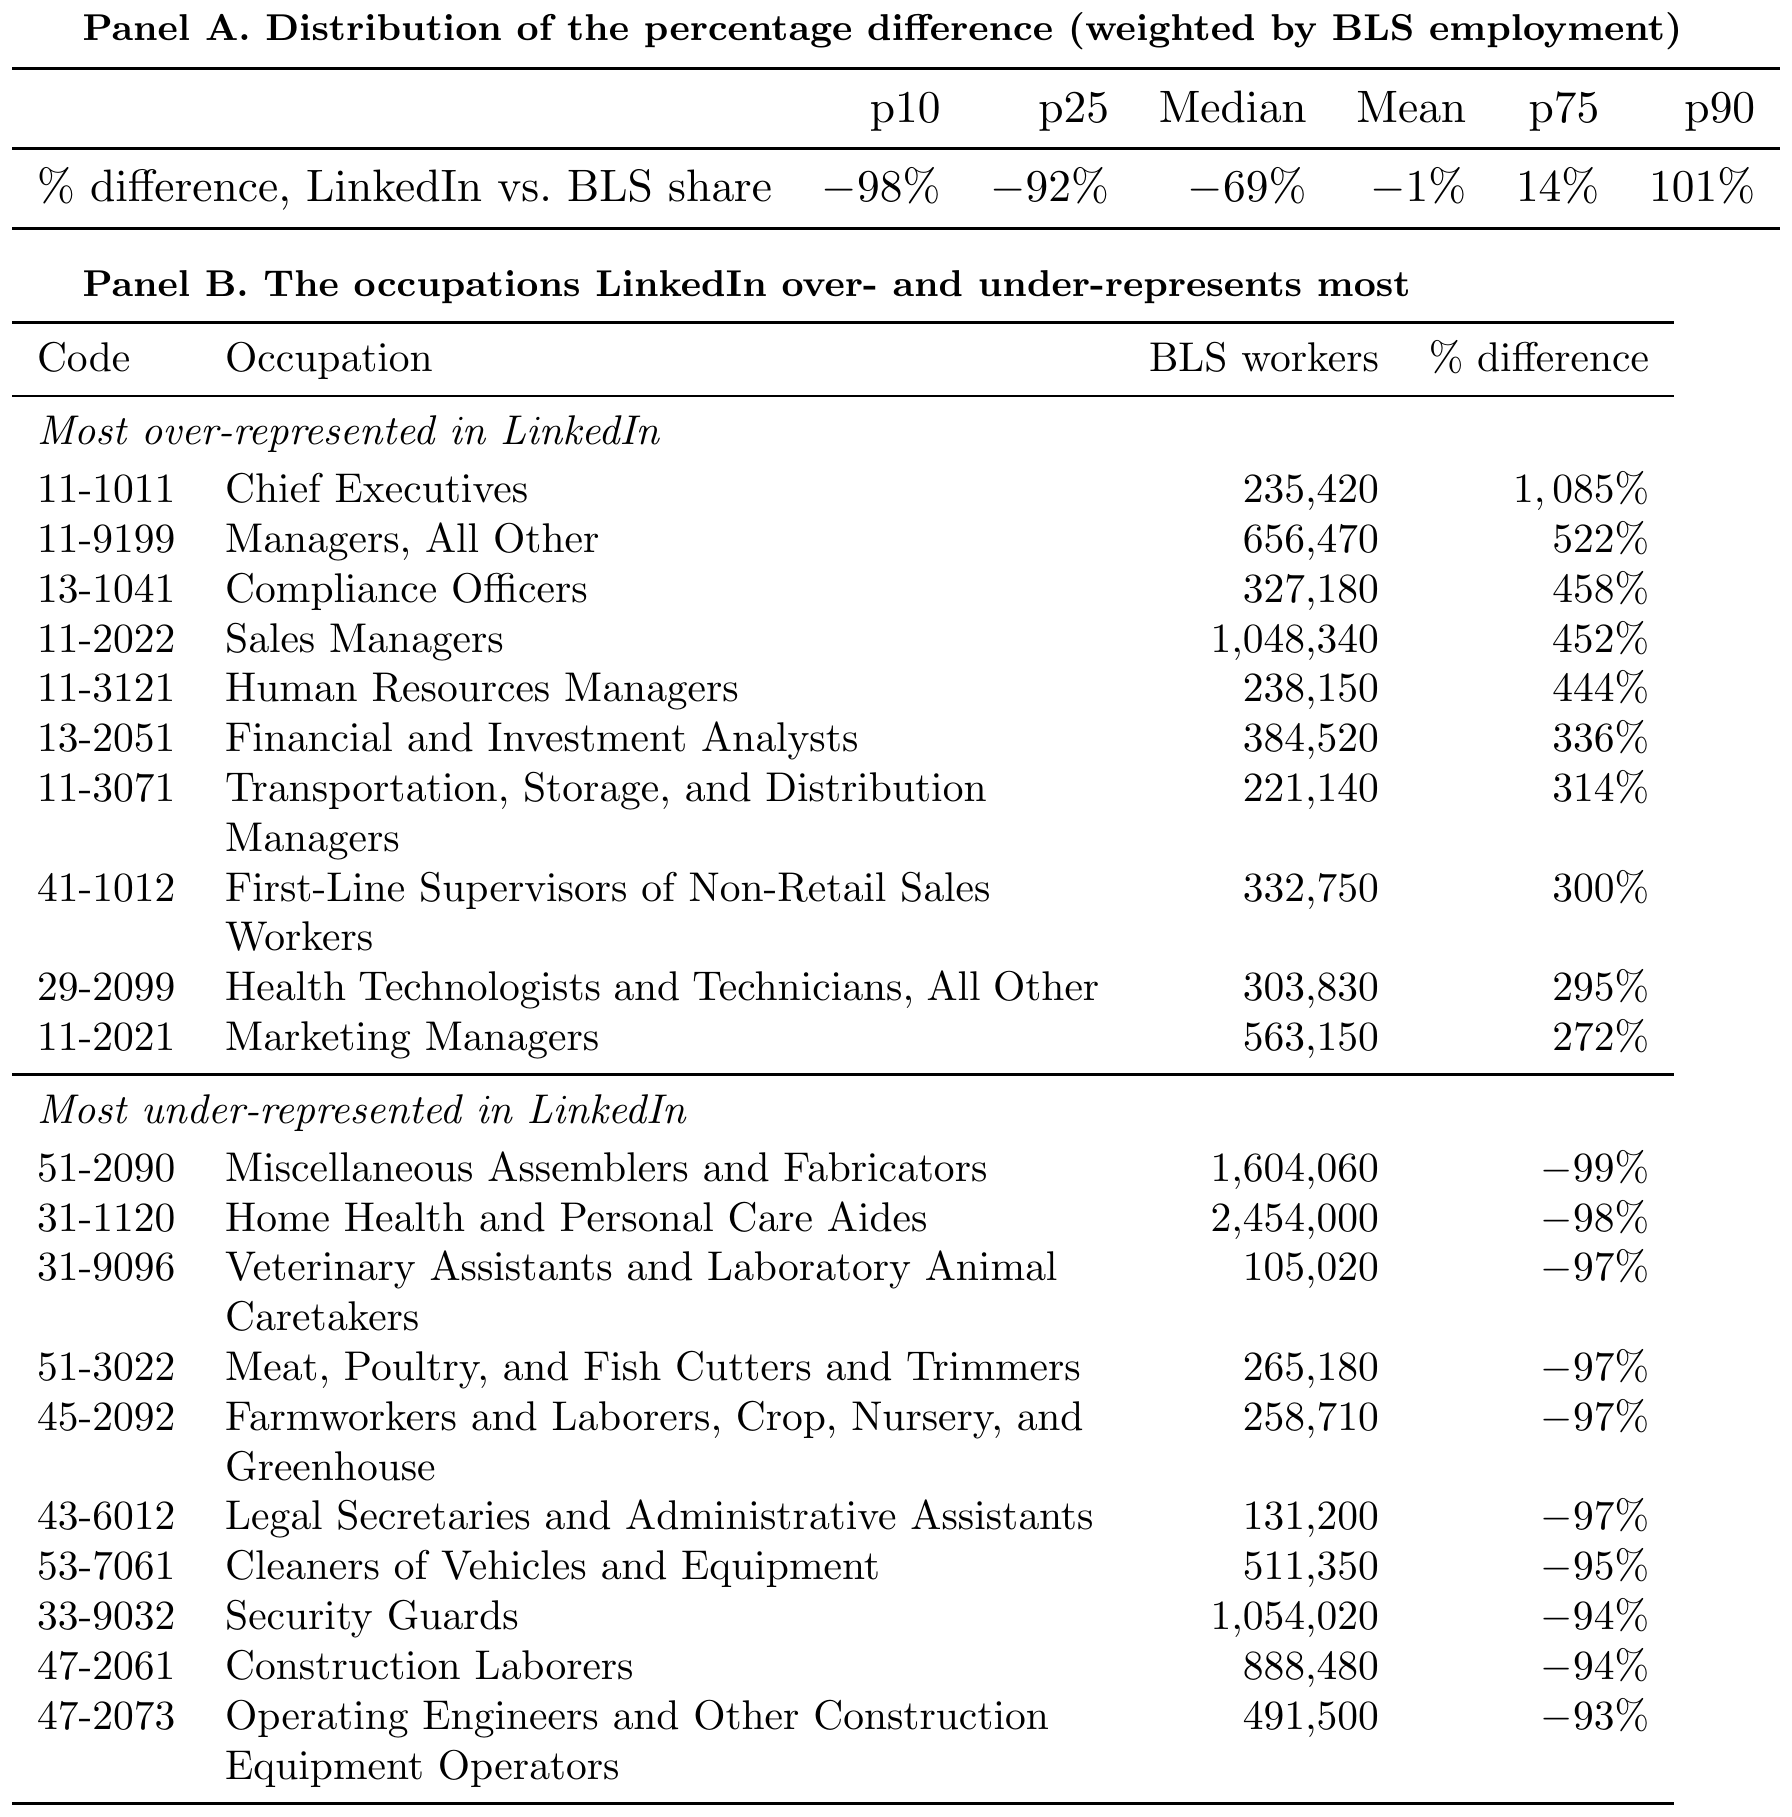
BLS appendix tables
Columbia Business School
Corporate Hierarchy

Bank ladders: step-three robustness

[TABLE PENDING: numbers/bank_ladder_v475onetj.tex, step three]
Columbia Business School
Corporate Hierarchy